ソーシャルメディアコンテンツ分析を極めて、隠れたパターンを見つけましょう。
高度なソーシャルメディアコンテンツ分析を活用し、さまざまなコンテンツの柱のパフォーマンスを比較できます。コンテンツ最適化の戦略も発見できます。
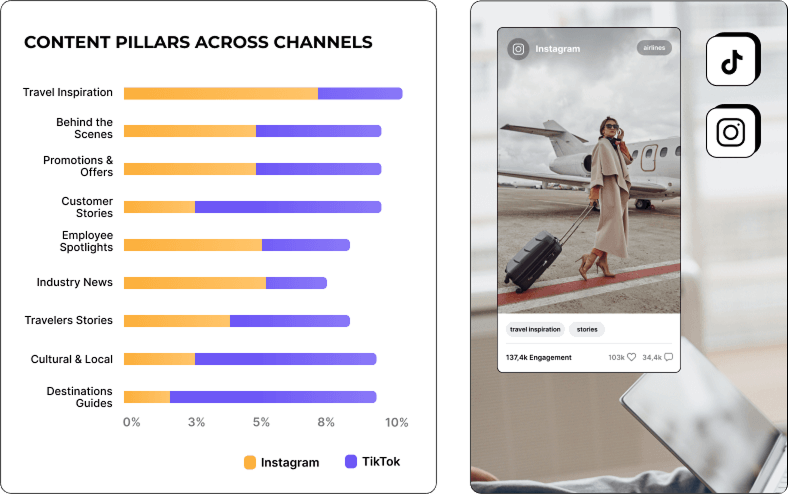


AIコンテンツの柱でソーシャルメディア戦略を強化します
さまざまなAIコンテンツテーマのインサイトを探り、オーディエンスに響く要素を発見します。投稿を最適化し、本当に繋がるソーシャルメディア戦略を実現しましょう。
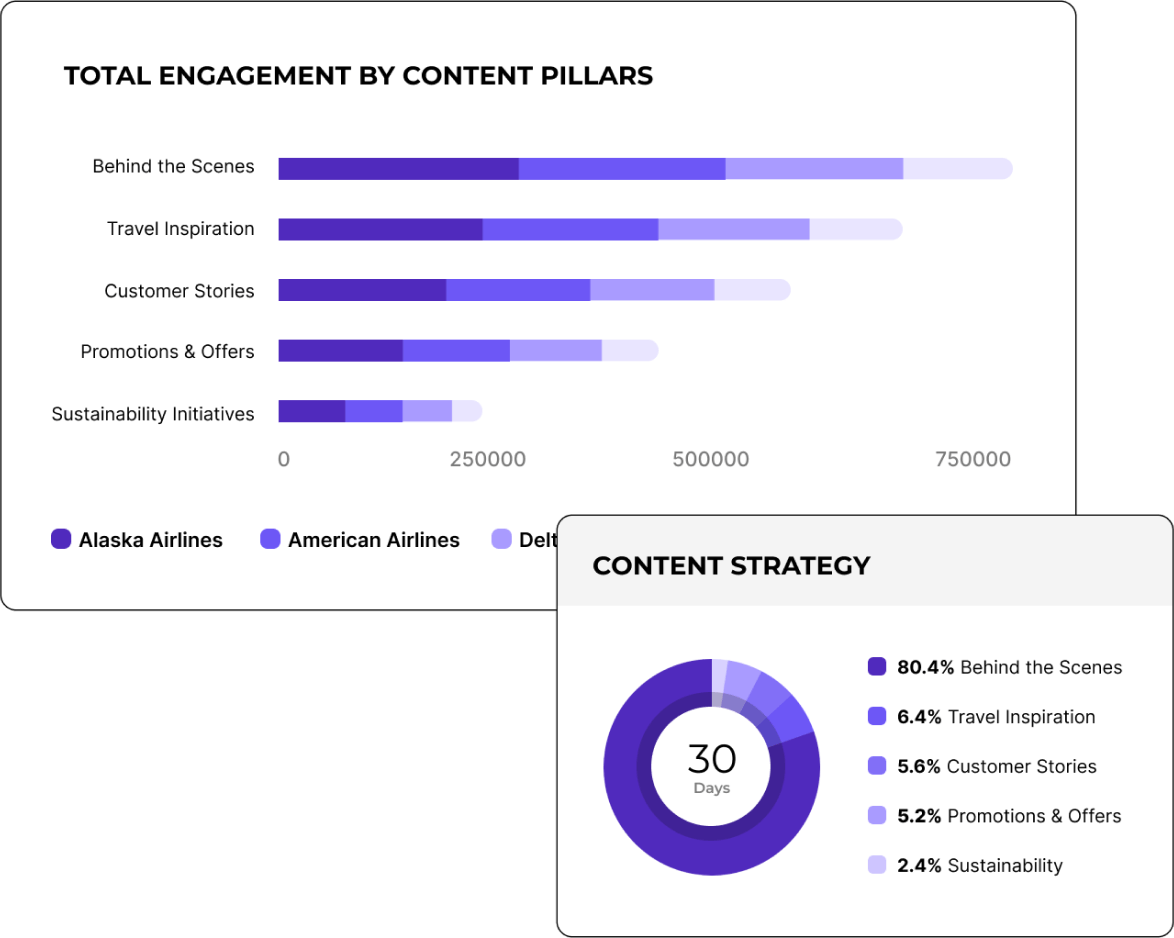
競合他社のコンテンツをAIでセグメント化します。
業界内で他社がうまくいっている方法を確認し、常に一歩先を行きましょう。自社のコンテンツと主要な競合他社を比較して、成功事例から学び、自分の戦略を磨きましょう。

"キャンペーン投稿のタグ付け機能により、コンテンツ戦略を非常に効率的に分析できました。"

イベントやキャンペーンごとにソーシャルメディア投稿をタグ付け・グループ化
投稿を検索し、特定のイベントやキャンペーンごとにタグ付けすることで重要なポイントを特定できます。何が効果的かを明確に把握し、毎回のキャンペーンを前回よりも向上させましょう。
Socialinsiderでエンゲージメント率を追跡する方法
Socialinsiderのソーシャルメディアアナリティクスと競合分析ツールで、ソーシャルメディアのパフォーマンスを計測し、監査を実施、成果を比較できます。
まずはSocialinsiderの無料トライアルアカウントを作成してください。
競合他社を追加し、ご自身が管理するプロフィールを連携します
あらゆるビジネスアカウントのエンゲージメントメトリクスをすべて取得します
主要な競合他社と自社のパフォーマンスを比較します
Perform a cross-channel analysis to evaluate your performance.

競合のインサイトを取得し、
ソーシャルメディアアナリティクスのメトリクスを確認しましょう。
お客様の声
"「カスタマーサービスも私のお気に入りの機能の一つです。皆さんは本当に素晴らしいです。御社のチームはとてもレスポンスが早く、親切で丁寧です。これは普通ではありません。」"

"Socialinsiderのおかげで、私たちが他のフォローしているアカウントと比較して、改善しているのか低下しているのかが明確に分かりました。"

"Socialinsiderでは、競合分析により市場に対するパフォーマンスのインサイトを得ることができます。"

"インスタグラムのハッシュタグに対するセンチメント分析は素晴らしいです。この新しいソーシャルメディアリスニングダッシュボードは、長期的なプランニングにとても役立ちました。"

"私たちは、すべての40社のソーシャルメディアクライアントにこのソーシャルメディアアナリティクスダッシュボードを活用しています。すべてのパフォーマンスデータを一括で管理できます。"

"Socialinsider導入により、チームの効率が向上しました。ソーシャルメディアのデータ収集に時間をかける必要がありません。代わりに、インサイトや分析に集中できます。"

"簡単な戦略変更の計画や特定のソーシャル投稿のパフォーマンスを確認する際、日々のソーシャルメディアインサイトにSocialinsiderを活用しています。"

"平均して、ブランド向けのソーシャルメディアレポート作成はSocialinsiderなら1~2時間で完了します。以前はデータ収集に丸一日かかっていました。"

"Socialinsiderは年間16,000ドル以上のコスト削減に貢献しています。月次レポートや複雑な長期分析にかかる時間も大幅に短縮できました。"

よくあるご質問
ご質問がありますか?私たちが答えます。
What is social media content analysis?
- The types of content that are performing well
- Topics that most resonate with your audience
- Your most engaging content + your engagement rate
- Your top posts based on reach and engagement
- How your audience feels about your brand and its content
As a marketer, you need to have your thumb on your overall social media content performance so that you can continuously adjust and adapt your social media strategy to maximize performance, reach, and growth.
Why is social media content analysis important?
適切なソーシャルメディアコンテンツ分析による主なメリットをご紹介します。
オーディエンスの理解を深める
コンテンツ、エンゲージメント率、オーディエンスの反応を分析することで、何に関心があるのか、どのようにアプローチできるのかを把握できます。
例を見てみましょう。真空断熱ボトルを販売するビジネスを運営している場合、アウトドア風景で商品の使い方を紹介するソーシャルメディアキャンペーンを実施したとします。しかし、商品のカラーバリエーションをアーティスティックで編集されたグラフィックでアピールした投稿の方が、オーディエンスには人気だと気づきます。
このことから、想定していたアウトドア志向のグループというよりも、商品の見た目やデザインを重視する層が多いことが分かります。
人気の高いコンテンツに注目することで、オーディエンスが何に共感し、なぜ商品を購入するのか、どのような情報を求めているかを理解できるようになります。
ソーシャルメディア戦略の効果を評価
ソーシャルメディアコンテンツ分析は、リアクションやコメント、シェアなどの主要なメトリクスを追跡できるため、戦略の効果を明確に把握できます。
エンゲージメントの高いコンテンツを監視し、トップ投稿を把握してください。また、競合他社と比較し、戦略の有効性を見極めましょう。
トレンドやパターンの特定
ソーシャルメディアコンテンツを分析することで、人気のコンテンツテーマやトレンドを見つけやすくなります。戦略の一部として、さまざまなコンテンツピラーや投稿タイプを共有しているはずです。
例えば、オンラインの観葉植物ブティックなら、下記のような投稿を交互に発信している場合があります。
- 植物の写真
- 商品を紹介するプロモーション投稿
- 植物のケアに関するアドバイス
ソーシャルメディアコンテンツ分析を行うことで、どのタイプの投稿が最も人気かを把握できます。
さらに、週末の投稿がパフォーマンスが良い、特定の植物や商品に関心が集まりやすいなど、他のトレンドやパターンも見つけられます。
また、競合他社のソーシャルメディア投稿も分析し、人気投稿のトレンドも参考にできます。
コンテンツ戦略の最適化
コンテンツ分析によって、テキスト投稿、画像、グラフィック、動画など、どの投稿タイプが最も人気か把握できます。これを元に、ソーシャルメディアコンテンツ戦略を最適化し、オーディエンスに好まれる投稿を増やしましょう。
複数の投稿タイプを組み合わせることも大切ですが、成果の出ないコンテンツタイプは思い切って減らして構いません。
ソーシャルメディアのROI向上
成果が出るコンテンツを理解できれば、さらに多く発信できます。質が高く成果の出るコンテンツが増えれば、より多くの結果が期待できます。
反応やコメント、シェアが増えれば、フォロワー数やクリック、売上増加につながります。マーケティング活動の成果として、ソーシャルメディアのROI(投資対効果)がアップします。
ROIの継続的な向上は、マーケティング予算の拡大と事業成長の両方に貢献します。
競争力を維持
定期的にソーシャルメディアコンテンツ分析を行うことで、戦略の競争力が保てます。自社と競合他社のパフォーマンスを比較しましょう。成長ペースやエンゲージメントも比較してください。
ソーシャルメディアのデータを常にチェックすることが、業界他社に遅れを取らず、競争力を維持する唯一の方法です。
ソーシャルメディアでコンテンツ分析を行う方法は?
ステップ1:目的を明確にする
他のマーケティング分析と同様に、目的を明確にすることが重要です。ソーシャルメディアコンテンツのゴールは何ですか?分析開始前に達成したい内容を知っておくことで、正しい方向に進んでいるかを判断できます。
ソーシャルメディアコンテンツの一般的な目的例:
- ブランド認知度の向上
- オンラインプレゼンスの拡大
- オーディエンスとのエンゲージメント向上
- ウェブサイトへのトラフィック送客
- 売上獲得
マーケティング戦略の目的は、測定するメトリクスに直結します。ここから次のステップへ進みましょう。
ステップ2:ソーシャルメディアコンテンツの主要メトリクスを選定
ソーシャルメディアのすべてのメトリクスを分析する必要はありません。時間がかかり、ゴールに沿ったヒントを得にくくなります。
達成したい内容に関連する主要なメトリクスを絞って選びましょう。これにより、コンテンツが目標達成に貢献しているか、改善が必要かを判断できます。
例えば、以下のようなメトリクスと目的があります。
- ブランド認知度向上:インプレッション、リーチ、動画視聴回数、フォロワー数
- オンラインプレゼンス拡大:リーチ、フォロワー数
- エンゲージメント向上:エンゲージメント率、いいね、コメント、シェア
- トラフィック送客:クリック数
- 売上獲得:コンバージョン数
ステップ3:データ収集による分析強化
続いて、データを収集します。主な方法は2つです。
- 各ソーシャルメディアプラットフォーム標準搭載のアナリティクスツール:ビジネスアカウント登録で利用可能。InstagramインサイトやTikTokアナリティクスなど。アプリだけで、オーディエンスやコンテンツのパフォーマンスなどのデータに簡単にアクセスできます。
- サードパーティ製ソーシャルメディアアナリティクスツール:全てのソーシャルメディアアナリティクスを一元管理できるダッシュボードを提供し、より詳細なデータとインサイトも得られます。
標準のツールは無料(アプリ付属)。一部のアナリティクスツールは無料プランもありますが、より詳細なソーシャルメディアコンテンツアナリティクスには予算を確保する必要があります。
例えば、Socialinsiderは14日間の無料トライアルと月99ドル~の有料プランを提供。幅広いソーシャルメディアインサイトでブランドの意思決定をサポートします。
ステップ4:コンテンツをカテゴリー分け
データ収集方法を選んだら(複数プラットフォームを比較しやすいサードパーティツールがおすすめ)、コンテンツをカテゴリー分けし、本格的にソーシャルメディアコンテンツ分析に取り組みましょう。
Socialinsiderでコンテンツを分類する場合は3つの方法があります。
1つ目は、AIツールで通常投稿している内容から自動的にコンテンツピラーを生成。手間なくカテゴリー化でき、簡単です。
2つ目は、投稿内でキーワードやハッシュタグで手動検索し、特定のテーマやイベント、キャンペーンの投稿数を確認する方法。
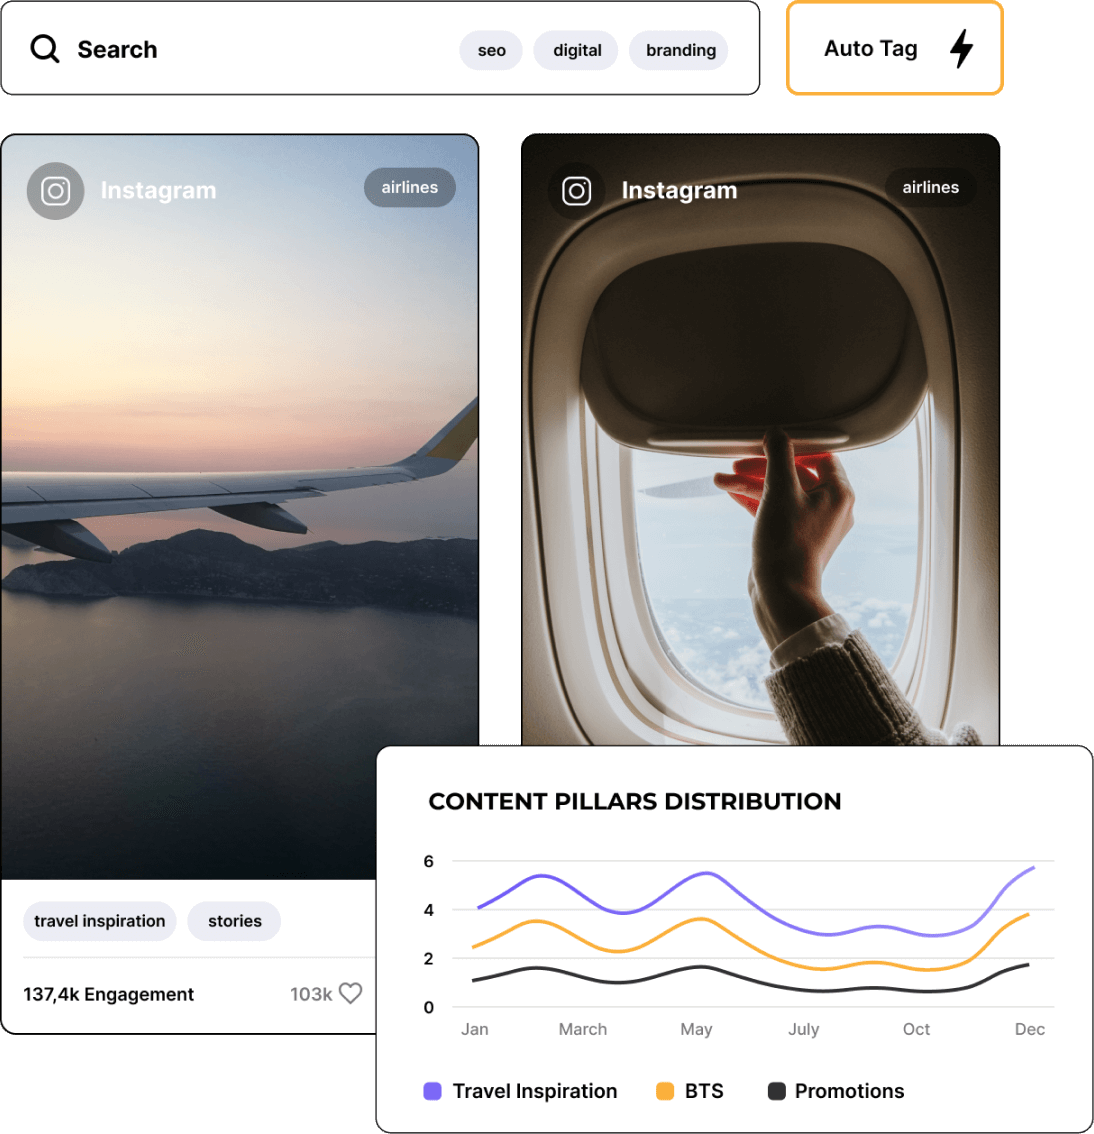
3つ目は、よく投稿するテーマに即したキーワードやハッシュタグ検索からAuto Tagを作成し、テーマごとに投稿を素早く絞り込む方法。特定テーマ・内容を継続的に分析したい場合に便利です。
Auto Tagを設定すると、対象キーワードやハッシュタグを使った過去・今後のすべての投稿が自動的にタグ付けされます。
Auto Tagには名前をつけておき、分析時に簡単に呼び出せるようにしましょう。ソーシャルメディアコンテンツ分析は多様なテーマで行うため、これらのカテゴリ設定が不可欠です。
ステップ5:各プラットフォームのソーシャルメディアコンテンツを分析
いよいよコンテンツ分析へ。Socialinsiderならダッシュボードで左サイドバーのContent Pillarsをクリックし、自身のコンテンツピラーまたはAI生成されたピラーからトピックを選択します。
トピックを選んだら、ソーシャルメディアプラットフォームを選択。
画面上部のドロップダウンで分析期間を選びましょう。月次や四半期ごとでパフォーマンスを確認できます。スクロールして成果をチェックしましょう。
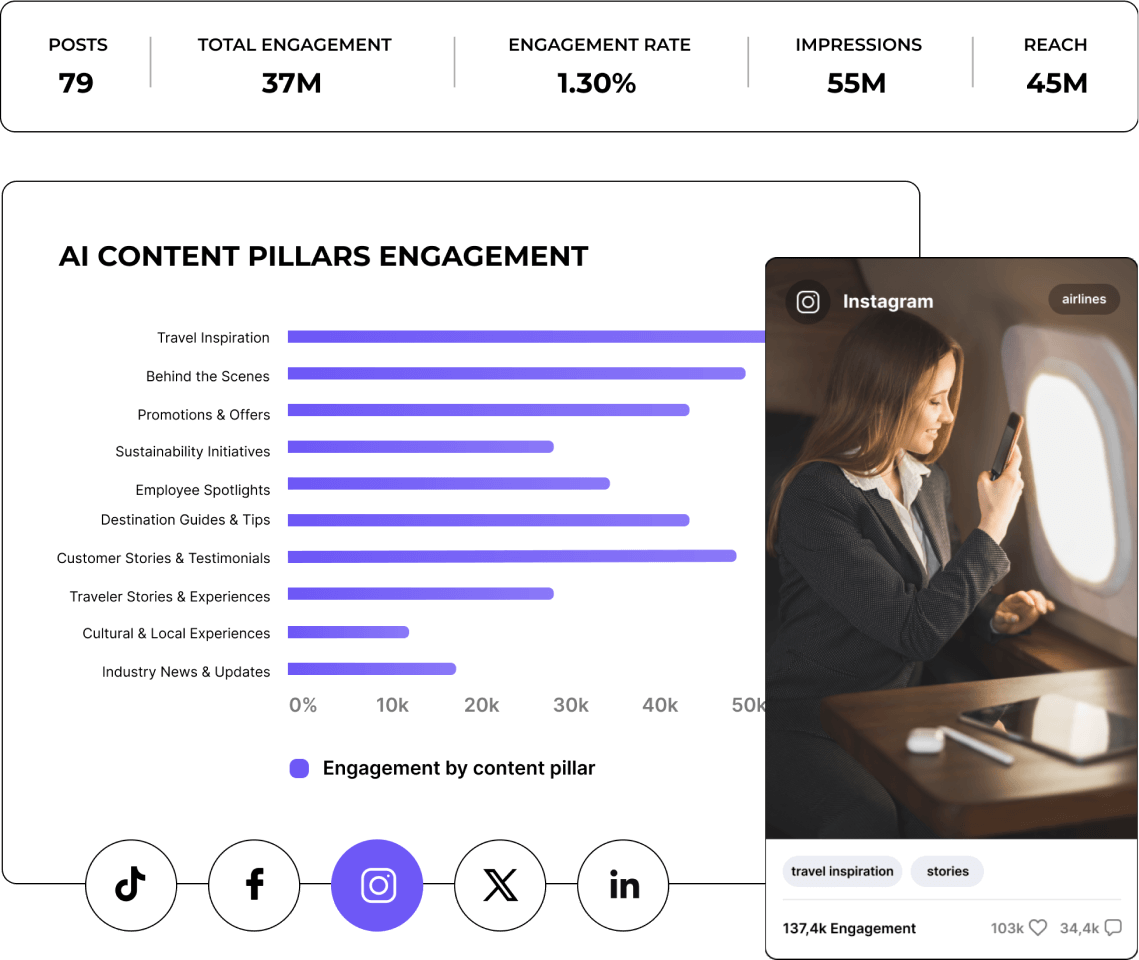
ステップ6:エンゲージメントパターンを分析
各プラットフォームの成果を見る際には、エンゲージメントの傾向にも注目しましょう。
Socialinsiderで得られるデータ例:
- 選択した期間内のピラー内投稿数
- フォロワー増加数
- 平均エンゲージメント(コメント数・いいね数・シェア数など)
- フォロワーあたりの平均エンゲージメント率
- トップ10投稿
- 投稿ごとのエンゲージメント数
このようなインサイトを活用すれば、最もエンゲージメントを集めるコンテンツピラーを特定し、成果向上に向けて優先的に制作できます。
ステップ7:競合とのベンチマーク
Socialinsiderでは自社だけでなく、任意のプロフィールのソーシャルメディアコンテンツピラーも特定可能です。競合他社のプロフィールも追加し、人気トピックや関連投稿を分析しましょう。他社の内容も参考にして、自社オーディエンスとのエンゲージメント施策に活かせます。
ソーシャルメディアコンテンツ分析のコツは何ですか?
適切なメトリクスに注力しましょう
すべてのメトリクスをモニタリングしようとして自身を圧倒しないようにしてください。まずゴールを明確にし、そのゴールに関係するメトリクスやKPIのみにフォーカスしましょう。
よくあるソーシャルメディアコンテンツの目的別に追跡すべきメトリクスは以下です:
- ブランド認知:インプレッション、リーチ、ビデオ視聴回数、フォロワー
- 成長:リーチ、フォロワー
- エンゲージメント:エンゲージメント率、いいね、コメント、シェア
- ウェブサイトトラフィック:クリック数
- 売上:コンバージョン
達成したいゴールを1~2個に絞り、メトリクスを増やしすぎないようにしましょう。KPIが多すぎると全体像がつかめず、本質的な成長に影響しないデータばかりを見てしまいがちです。
データの整理
正しいツールやスプレッドシートでデータ管理を徹底しましょう。各ソーシャルネットワークのアナリティクスを個別に見るのではなく、全コンテンツアナリティクスをまとめて管理できるサードパーティーツールの活用がおすすめです。
レポートの形式(PDF、CSV、Excelなど)を選び、毎回同じフォーマットでレポートをエクスポートすると、管理が一層効率化します。
毎月または四半期ごとに同じタイミングでレポートを作成し、同じフォルダーに保存するといつでも参照可能です。データ整理は一貫した高品質な分析の鍵です。
ソーシャルメディアアナリティクスツールを活用
Socialinsiderのようなソーシャルメディアアナリティクスツールを活用すれば、分析全体がスムーズになります。すべてのアナリティクスが一つのダッシュボードに集約され、5つの異なるダッシュボードを見る必要がなくなります。
さらに多くのツールは、内蔵アナリティクスツール以上に深いインサイトを提供します。API連携や他のマーケティングツールとの連携により、より詳細な分析が可能になります。
たとえば、Instagramのアナリティクスだけではウェブサイトへのクリックが売上につながったかは分かりませんが、サードパーティーのツールでInstagramとウェブサイトアナリティクスを連携させれば、その情報を把握できます。
パターンとトレンドを見つける
分析の大部分は、コンテンツ間やその成果の中で似ている点や傾向を見つけることです。
Socialinsiderのコンテンツピラー機能は、こういった傾向分析に最適なダッシュボードを作り出し、どのトピックが特にエンゲージメントを得やすいかを可視化します。
競合のコンテンツもベンチマークできるので、業界内のトレンド分析も可能です。競合と自社のトピックや成果が似ているか比較し、なぜその傾向があるのか考察しましょう。
コンテンツのライフスパンを管理する
コンテンツライフスパンとは、ひとつのコンテンツのリーチやエンゲージメントがどれほど続くかを指します。毎月のトップ投稿や成長を追うことで、どれくらい長くオーディエンスを獲得し続けられるかが分かります。
ライフスパンを把握すれば、パフォーマンスの高いプラットフォームやテーマに優先的に力を入れられます。たとえば、LinkedInの方がX/Twitterより成果が長期間持続する場合は、LinkedInでのコンテンツ制作がより価値あることが理解できます。
定期的なコンテンツ監査を実施
コンテンツ監査は、ソーシャルメディアコンテンツ分析をさらに掘り下げたものです。長期にわたるコンテンツパフォーマンスを抽出し、テーマの傾向把握だけでなく、改善点を見つけることが目的です。
低パフォーマンスの投稿タイプを排除し、制作・公開プロセス全体の向上、そしてより良いマーケティング戦略へとつなげられます。
ビジュアルレポートで成果を伝える
ソーシャルメディアコンテンツ分析の結果を伝える際は、見やすく理解しやすいビジュアルレポート化がおすすめです。
表やグラフを使えば、数字のリストやスプレッドシートよりも、成果を直感的に伝えられます。
Excelのようなスプレッドシートで表をグラフ化したり、Socialinsiderなどのサードパーティーアナリティクスツールでもラインチャートや棒グラフなど、多様なビジュアルレポートが作成可能です。
Socialinsiderでソーシャルメディアのコンテンツ分析を行うにはどうすればいいですか?
ステップ1: Socialinsiderアカウントを作成します。最もリーズナブルなプランは月額$99からで、複数のレポートにアクセスできます。
ステップ2: ソーシャルメディアアカウントを接続します。Socialinsiderは以下のプラットフォームに対応しています。
・TikTok
・X/Twitter
・YouTube
ステップ3: 読みやすいレポートにアクセスします。これらのレポートは、Socialinsiderダッシュボードの左サイドバーからご覧いただけます。
主なレポート例:
・コンテンツパフォーマンス
・エンゲージメント
・インプレッション
・フォロワー増加
・コンテンツピラー
・投稿概要
・競合比較
ソーシャルメディアコンテンツ分析で特に重要なレポートは、コンテンツ概要、コンテンツピラー、投稿概要です。どの投稿が高い成果を上げたか、どのトピックに分類されるか、期待通りでなかった投稿はどれかを把握できます。
AIによるコンテンツピラーはソーシャルメディアアカウントごとに変更できますか?
ただし、ご自身でコンテンツピラーを作成・管理する方法があります。Socialinsiderダッシュボードで対象のソーシャルメディアアカウントをクリックし、投稿レポートに進んでください。
ここから、検索バーにご自身のハッシュタグ、キーワード、カテゴリを入力すると、それらを含む投稿が見つかります。そのハッシュタグ・キーワード・カテゴリを自動タグとして追加できます。過去と今後のすべての投稿が、タグを表示するだけで簡単にアクセス可能になります。
ソーシャルメディアアカウントに割り当てられている業種を変更できますか?
多くの場合、業界設定は非常に正確です。ただし、もし最適でない場合や、よりニッチな業界に変更したい場合、または業界を変更する場合でも、現在この機能は開発中です。
そのため、現時点ではソーシャルメディアアカウントに割り当てられた業界は変更できません。今後のアップデートにご期待ください。
ソーシャルメディアコンテンツ戦略を改善しませんか?
詳細なソーシャルメディアコンテンツデータを確認し、戦略的なインサイトを取得できます。コンテンツ戦略を最適化し、競争優位を獲得しましょう。