Facebook競合のベンチマークとアナリティクスをひとつに集約
Socialinsiderは、あなたのFacebookページと他の公開ページを同時にトラッキングします。エンゲージメント、成長、コンテンツ戦略を比較できます。数字だけのレポートにはなりません。


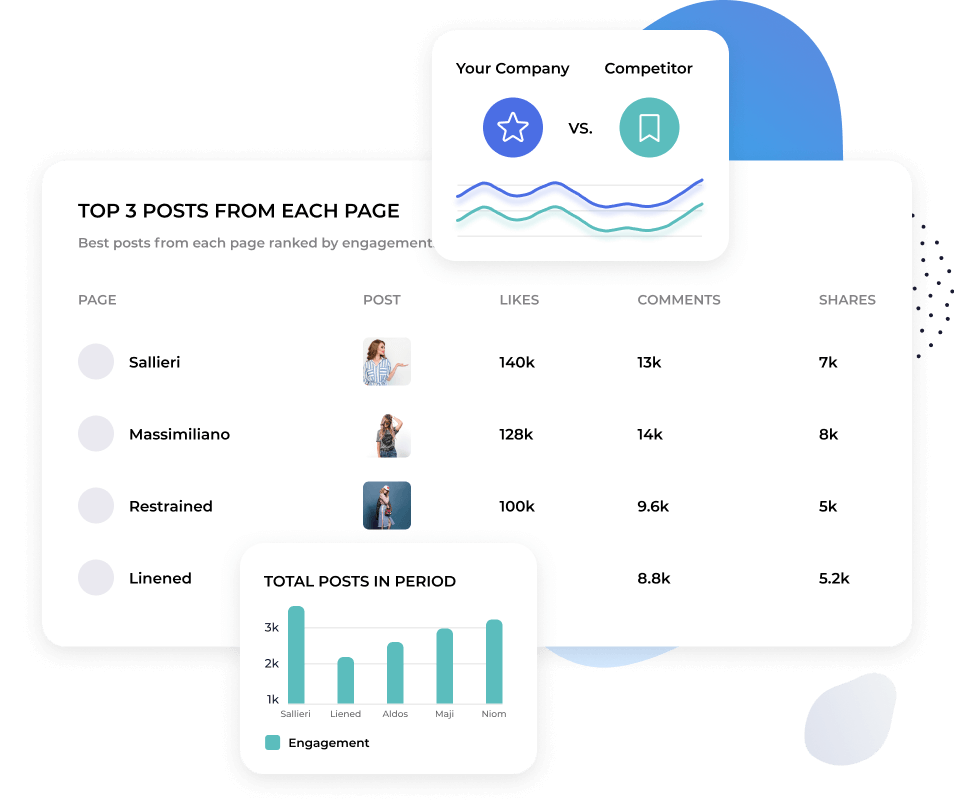
複数のFacebookページを1画面で比較
追跡したい競合をすべて追加し、まとめて一覧表示できます。
ページを1つずつ確認せず、競合全体のエンゲージメント、成長、投稿頻度を比較できます。
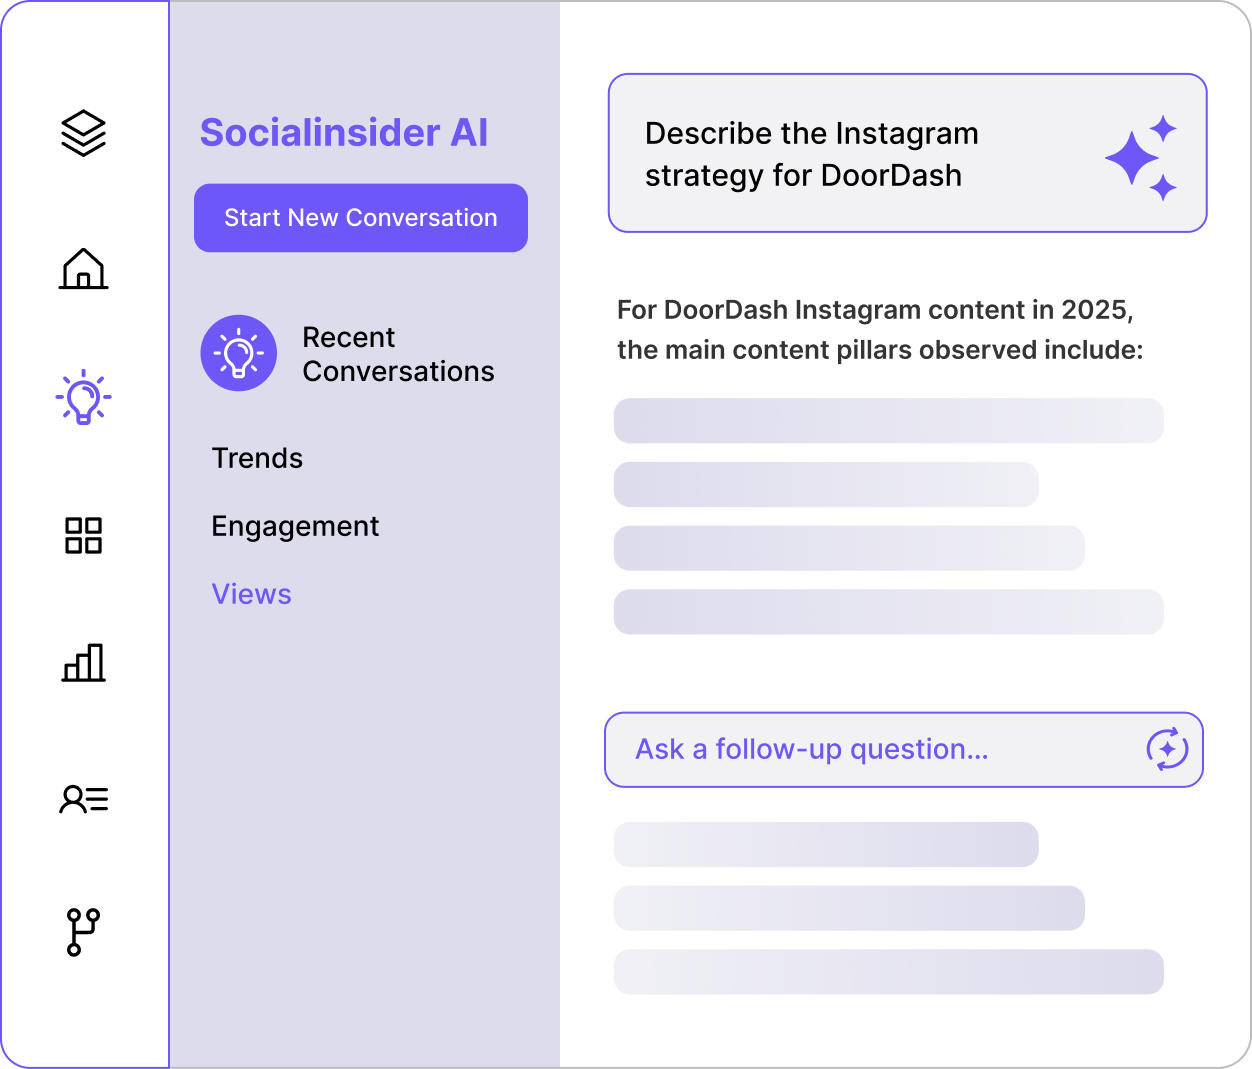
Socialinsider AIに何でも質問して、インサイトを発見しましょう。
Facebookの競合分析が、即座に回答が得られるので簡単です。
Socialinsider AIにシンプルな言葉で質問できます。自分のアカウント、競合データ、市場ベンチマークをリアルタイムで分析します。「今月エンゲージメントが下がった理由は?」などの質問にも数秒で答えます。

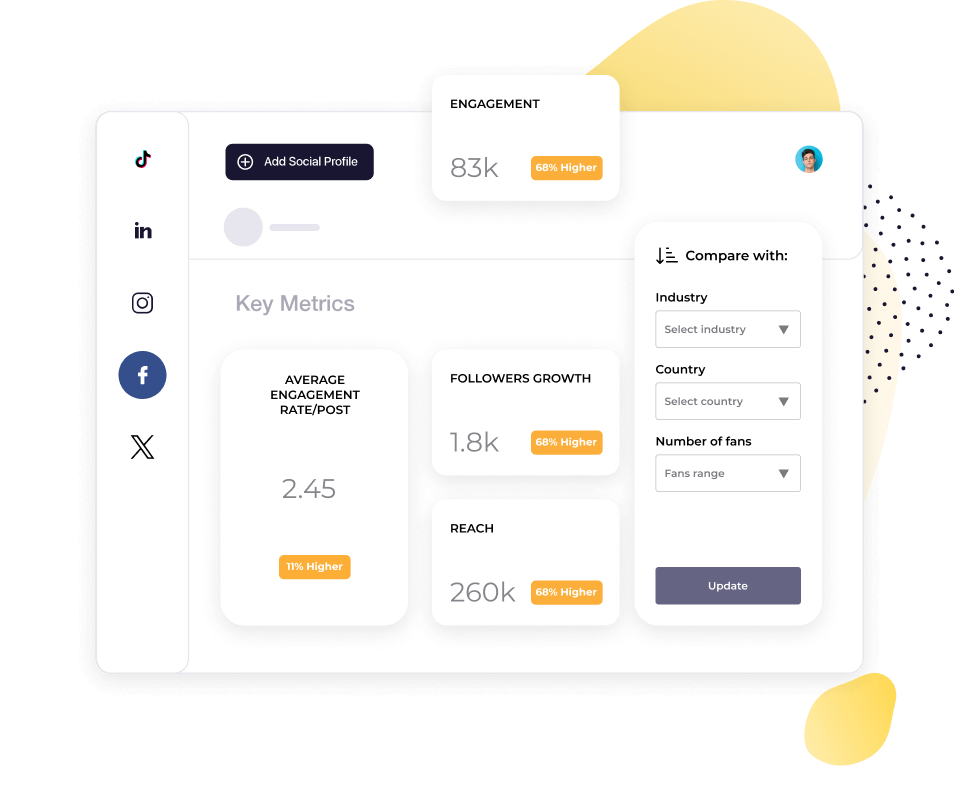
"競合分析によって、市場での自社のパフォーマンスが可視化されました。"

市場の変化をすばやく把握できます。
エンゲージメントが下がった時、まず考えるべきはそれが全員に起きているのか、自分だけなのかということです。
Socialinsiderは、自社と競合のトレンドを並べて表示します。推測ではなく、すぐに違いを確認できます。
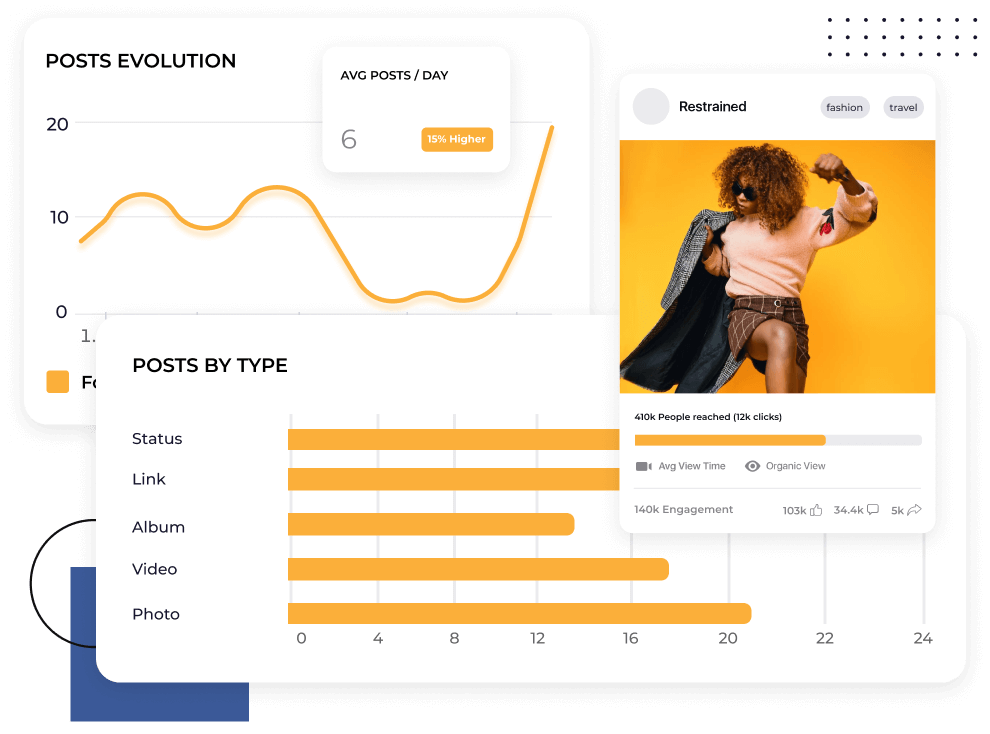
今、Facebookで効果的なコンテンツを見つけましょう
1年前にFacebookのアルゴリズムで通用したことが、今は通用しない場合があります。
Socialinsiderは、あなたの市場で成果を上げているコンテンツタイプを特定します。パターンを把握し、いいね・コメント・シェアが集まる投稿が可能になります。
お客様の声
"「カスタマーサービスも私のお気に入りの機能の一つです。皆さんは本当に素晴らしいです。御社のチームはとてもレスポンスが早く、親切で丁寧です。これは普通ではありません。」"

"Socialinsiderのおかげで、私たちが他のフォローしているアカウントと比較して、改善しているのか低下しているのかが明確に分かりました。"

"Socialinsiderでは、競合分析により市場に対するパフォーマンスのインサイトを得ることができます。"

"インスタグラムのハッシュタグに対するセンチメント分析は素晴らしいです。この新しいソーシャルメディアリスニングダッシュボードは、長期的なプランニングにとても役立ちました。"

"私たちは、すべての40社のソーシャルメディアクライアントにこのソーシャルメディアアナリティクスダッシュボードを活用しています。すべてのパフォーマンスデータを一括で管理できます。"

"Socialinsider導入により、チームの効率が向上しました。ソーシャルメディアのデータ収集に時間をかける必要がありません。代わりに、インサイトや分析に集中できます。"

"簡単な戦略変更の計画や特定のソーシャル投稿のパフォーマンスを確認する際、日々のソーシャルメディアインサイトにSocialinsiderを活用しています。"

"平均して、ブランド向けのソーシャルメディアレポート作成はSocialinsiderなら1~2時間で完了します。以前はデータ収集に丸一日かかっていました。"

"Socialinsiderは年間16,000ドル以上のコスト削減に貢献しています。月次レポートや複雑な長期分析にかかる時間も大幅に短縮できました。"

SocialinsiderでFacebookのエンゲージメント率を追跡する方法
Socialinsiderのソーシャルメディアアナリティクスと競合分析ツールで、ソーシャルメディアのパフォーマンスを計測し、監査を実施、成果を比較できます。
まずはSocialinsiderの無料トライアルアカウントを作成してください。
競合他社を追加し、ご自身が管理するプロフィールを連携します
任意のFacebookビジネスアカウントで全てのエンゲージメントメトリクスを取得できます
主要な競合他社と自社のパフォーマンスを比較します
クロスチャネル分析でFacebookのパフォーマンスを評価します。

競合のインサイトを取得し、
ソーシャルメディアアナリティクスのメトリクスを確認しましょう。
よくあるご質問
ご質問がありますか?私たちが答えます。
Facebookアナリティクスとは何ですか?
Facebookアナリティクスとは、Facebookビジネスページのデータやメトリクスを収集・分析することです。これにより、ソーシャルメディアマーケティングの効果を測定できます。
Meta Business SuiteやFacebookインサイト、Socialinsiderなどのサードパーティアプリなど、さまざまなツールでアナリティクスを確認できます。これにより、オーディエンスの成長や行動、コンテンツやキャンペーンのパフォーマンス、マーケティング活動全体の効果についてインサイトが得られます。
Facebookアナリティクスが重要な理由
Facebookアナリティクスは、ビジネスやマーケターにとって自社ページやコンテンツ、キャンペーンのパフォーマンスを把握するために重要です。
Facebookアナリティクスダッシュボードは、オーディエンスのデモグラフィックやエンゲージメント率、広告費、コンバージョンメトリクスなどを全体から詳細まで確認できます。これらのインサイトを活用することで、戦略の最適化やターゲティングの精度向上、そしてビジネス成果の最大化に役立つ意思決定が可能です。
Facebookはユーザー数(30億以上)が最も多く、ソーシャルメディアプラットフォームの中で最多のデータを持っています。そのため、アナリティクスレポートは特に重要です。膨大なデータを整理し、正しく評価できれば、大きなビジネスチャンスにつながります。
Facebookデータ分析を効果的に活用すると、次のことが分かります:
- ターゲットにすべき相手
- 作成すべきコンテンツ
- 投稿のタイミング・場所・方法(最適な投稿時間、投稿タイプやフォーマット)
- 戦術や戦略がなぜ機能するか/しないか
…こうして、その大きな可能性を最大限活かせます。
FacebookアナリティクスとFacebookインサイトの違いは何ですか
Facebookアナリティクスは、Facebookページのデータやメトリクスを追跡・分析するための広範な用語です。大文字の“A”が付くFacebook Analyticsとは異なります。こちらはプラットフォームのネイティブアナリティクスアプリの名称で、2021年に提供終了となりました。
現在は、以下の方法でFacebookアナリティクスデータを取得できます。
FacebookインサイトFacebookインサイトは、ネイティブアプリ内で利用できるレポーティングツールです。ミクロレベルの詳細なアナリティクスを提供します。
Meta Business SuiteMeta Business Suiteは、FacebookとInstagramのビジネスプロフィールからマクロレベルのデータを集約するビジネスアナリティクスソフトウェアです。
サードパーティーツールプレミアムソーシャルメディアアナリティクスツールであるSocialinsiderのようなサービスは、高度なメトリクスや自動レポート機能を備えたプロフェッショナルなダッシュボードで、詳細なFacebook分析を可能にします。
Facebookアナリティクスツールのトップ3は何ですか?
Facebookのアナリティクスへのアクセス方法をお探しですか?Facebookアナリティクスソフトウェアを使えば、メトリクスやデータを監視・分析できます。しかし、選択できるツールは多数あります。
時間を節約するために、おすすめのレポーティングツールとその特徴をまとめました。
Facebookインサイト
Metaが提供するネイティブツールです。アプリ内からアクセスできます。
Facebookインサイトでは、ページや最新投稿に関する包括的なデータが得られます。オーディエンスの成長やコンテンツのパフォーマンスを把握できます。
インサイトでは、リーチ、いいね、コメント、シェア、オーディエンスの属性、注目すべき競合ページなどが分かります。これにより、認知度向上やページ運用に役立ちます。
Meta Business Suite
Meta Business Suiteはマーケティング担当者向けのもう一つのネイティブツールです。InstagramとFacebookのビジネスアナリティクスを一つの画面で管理できます。
複数のFacebookページやInstagramアカウントを一括管理、レポート作成が可能です。投稿パフォーマンスやオーディエンスインサイト、広告データなど、より詳細なメトリクスも取得できます。クロスプラットフォームの運用が効率化され、ソーシャルメディアマーケティングの全体像がつかめます。
Socialinsider
Socialinsiderは、サードパーティの強力なソーシャルメディアアナリティクスツールです。Facebookマーケティングの高度なインサイトが得られます。
Facebookページのパフォーマンスを、プロフェッショナルレベルのダッシュボードで詳細に追跡可能です。あらゆるページを比較・分析し、Facebook競合分析レポート作成やクロスプラットフォーム分析に活用できます。データはいつでも様々な形式で簡単にエクスポートでき、監査や成果共有もスムーズです。
これらすべてが、戦略の最適化と競争優位の獲得に役立ちます。
Facebookアナリティクスへのアクセス方法
Facebookアナリティクスインサイトにアクセスする3つの方法をご紹介します。
Facebookインサイトでアナリティクスにアクセスする方法
Facebookインサイトでアナリティクスにアクセスするには、以下の手順に従ってください。
- Facebookアカウントにログインします。
- ビジネスまたはファンページに移動します。
- 上部メニューの「インサイト」をクリックします。
各カテゴリで様々なメトリクスを確認できます。
- ページ概要:Facebookページのビュー、ページのいいね、インプレッション、投稿の合計リーチとエンゲージメントのサマリーが表示されます。
- オーディエンス:Facebookフォロワー数やその推移、言語、年齢、性別、所在地などのオーディエンス属性を確認します。
- 最近の投稿:リーチ、クリック、リアクション、コメント、シェア、動画の視聴回数をチェックできます。
Meta Business SuiteでFacebookアナリティクスにアクセスする方法
Meta Business Suiteでインサイトを見るには、以下の手順に従ってください。
- Facebookアカウントにログインします。
- Meta Business Suite(business.facebook.com) にアクセスします。
- ビジネスアカウントを選択します。
- 左側メニューの「インサイト」をクリックします。
Page Insightsにはない高度なデータ集計やマクロメトリクスが取得できます。
- 概要メトリクス:リーチ(有料・オーガニック)、3秒視聴回数、1分視聴回数、合計視聴分数、コンテンツインタラクション、リーチの内訳を確認できます。
- FacebookとInstagramの成果比較:リーチ、訪問数、純増フォロワーを比較できます。
- 既存と潜在オーディエンス:現オーディエンスの属性と、ターゲット可能な潜在ユーザーのメトリクスが見られます。
- ベンチマーク:業界インサイトやFacebook競合分析が可能です。
- コンテンツ概要:全ての投稿フォーマット(リール、動画、ライブ、通常投稿、ストーリーズ)、トップコンテンツやオーディエンス維持率もチェックできます。
SocialinsiderでFacebookアナリティクスにアクセスする方法
Socialinsiderは、高機能なFacebookアナリティクスツール で、コンテンツパフォーマンス・プロフィール成長・インサイトを1か所で管理できます。
SocialinsiderでFacebookアナリティクスにアクセスするには、以下を行ってください。
- socialinsider.ioでアカウント登録またはログインします。
- 新規プロジェクトを作成するか、既存プロジェクトに移動して「ソーシャルアカウントを接続」をクリックします。
- Facebookアカウントを連携し、追加したいページを選択します。
- ダッシュボードから分析したいページを選択できます。
総合的なページサマリーが表示され、重要なKPIやチャートを自由に選べます。詳細分析も、エンゲージメント、リーチ、インプレッション、オーディエンスなどを切り替えてチェック可能です。
Socialinsiderで得られるアナリティクスの例:
- 過去投稿のデータ
- 主なFacebookアナリティクスメトリクス:コンテンツ、エンゲージメント、推定リーチ(正確なリーチ指標はFacebookのみに依存。他データに基づき推計)、インプレッション、オーディエンス属性、トップ投稿、動画メトリクス
- ソーシャルメディア競合分析:業界全体や直接競合との比較
- 成果の高いコンテンツフォーマット
- リールアナリティクス
- 動画アナリティクス
- クロスチャネル分析:FacebookページとInstagramのパフォーマンス比較
必要なデータを含んだFacebookアナリティクスレポートをエクスポートまたはスケジュールできます。
追跡すべきFacebookページアナリティクスメトリクスは?
Facebookのデータレポートは、ソーシャルメディアマーケティング戦略の効果に関する貴重なインサイトを提供します。
ただし、Facebookメトリクスが非常に多いことで圧倒されるかもしれません。それぞれは何を意味していますか?どれを追跡すべきでしょうか?そして、どうすればそのデータを活用してビジネスの成功につなげることができるのでしょうか?
ここで知っておくべきポイントをご紹介します。
Facebookデータの分析方法
Facebookページのアナリティクスを初めて監視するときは、自社にとって何が重要かを考えることから始めます。
もし自社のページをファネルの最上部でブランド認知向上のチャネルとして活用している場合、オーガニック投稿がバイラル化し、より多くのオーディエンスにリーチできることが理想です。この場合はリーチ、インプレッション、フォロワー/ファンの増加、エンゲージメントを優先しましょう。
また、Facebookを収益を生み出す重要な獲得チャネルとして使うなら、ROIを最大化できているかFacebook広告のアナリティクスをしっかり確認しましょう。
こうした目標を先に明確にすることで、Facebookアナリティクスを深く理解し、その価値を最大限に活用できます。そして、どのメトリクスが進捗を示しているかが明確になります。
Facebookのメトリクスは以下に分類できます:
- ページアナリティクス
- オーディエンスインサイト
- 投稿アナリティクス
- ストーリーズアナリティクス
- リールアナリティクス
- ビデオアナリティクス
- ライブアナリティクス
- 広告アナリティクス
それぞれのカテゴリを詳しく見ていきましょう。
追跡すべきFacebookページアナリティクスメトリクス
Facebookビジネスページのアナリティクスでは、ページのパフォーマンスに関わるあらゆる項目(リーチ、インプレッション、エンゲージメント、クリック数、メンション数、フォロワー数)を網羅しています。
これらのインサイトから、ユーザーがどのようにページおよびコンテンツと関わっているかを把握でき、投稿や活動の効果を理解できます。
ページアナリティクスを追跡する重要性は、コンテンツ作成に多くの手間がかかるからこそ、個別の投稿パフォーマンスだけに注目しがちになる点にあります。しかし、本当に成果を上げるためには全体像も考慮した戦略が必要です。
Facebookページのメトリクスはブランド全体の存在感を測るリトマステストです。投稿や活動がブランド認知を高め、オーディエンスとエンゲージし、トラフィックを増やしているかのフィードバックループとなります。
リーチ - Socialinsiderで推定値として取得可能リーチは、そのページまたはその情報を見たユニークアカウント(個別ユーザー)の数です。
リーチデータはMetaおよびSocialinsiderで推定値として確認できます。
インプレッション - Socialinsiderで取得可能インプレッションは、そのページやページに関する内容がユーザーのフィードに表示された回数です。
エンゲージメント - Socialinsiderで取得可能エンゲージメントは、投稿に対するユーザーの全ての反応数(いいね、コメント、シェア)です。
投稿別エンゲージメント率(リーチ/フォロワー別) - Socialinsiderで取得可能エンゲージメント率は、コンテンツに反応した人数を、見た人数(リーチ)または全てのフォロワーで割って算出したパーセンテージです。
リンククリック数 - Socialinsiderで取得可能リンククリック数は、投稿内のリンクがクリックされた回数です。
メンション数 - Socialinsiderで取得可能メンション数は、他のページやユーザーが自身の投稿であなたのページを言及した回数です。
投稿形式別エンゲージメント - Socialinsiderで取得可能投稿形式別エンゲージメントは、テキスト、写真、ビデオなど、どのタイプのコンテンツが最も多くのエンゲージメント(いいね、コメント、シェア)を獲得しているかを示します。
フォロワー数 - Socialinsiderで取得可能フォロワー数は、ページに「いいね」またはフォローしたユーザーの総数です。
フォロワー成長率 - Socialinsiderで取得可能フォロワー成長率は、特定期間(週単位、月単位、年単位、カスタム日付)でページのフォロワーが何%増加したかを示します。
追跡すべきFacebookオーディエンスメトリクス
Facebookオーディエンスインサイトは、オーディエンスの属性、行動、好みを把握し、ターゲットを絞ったコンテンツ作成に役立ちます。含まれるメトリクスは、年齢・性別、地域、言語、ポテンシャルオーディエンスです。
ソーシャルメディアペルソナを把握することは、あらゆる成功するソーシャルメディアマーケティング計画の基盤です。この貴重な情報により、コンテンツや活動を最適化し、適切な人にリーチ・エンゲージできます。例えば、地域限定のFacebookグループを立ち上げたり、特定の国や地域のインフルエンサーと協力が可能です。
オーディエンスインサイトは、既存のフォロワー/ファンだけでなく、関心を持つ可能性のある幅広いユーザー群も可視化するなど、追加データを活用できるメリットがあります。両方を監視することで、ブランドコミュニティの成長と育成が続けられます。
年齢・性別 - Socialinsiderで取得可能フォロワーを年齢層・性別ごとに分類したデモグラフィック分布です。
地域 - Socialinsiderで取得可能オーディエンスの居住地域分布です。フォロワーが多い都市や国を表示します。
言語 - Socialinsiderで取得可能オーディエンスが主に話す言語です。
ポテンシャルオーディエンス - Metaで追跡ターゲット条件に合っており、コンテンツや広告でリーチできる可能性がある推定ユーザー数です。
追跡すべきFacebook投稿アナリティクスメトリクス
Facebook投稿アナリティクスは、個別投稿ごとの詳細なメトリクスで、パフォーマンスをより細かく分析できます。主な指標はインプレッション、リーチ、リンククリック数、エンゲージメント、エンゲージメント率、動画/リールの再生数、トップ投稿、ワースト投稿、テーマやカテゴリごとのインサイトです。
トップパフォーマンスとワーストパフォーマンス両方の投稿を追跡すると、繰り返し現れる傾向を把握でき、効果的な取り組みはより強化し、うまくいかない施策は減らせます。
投稿インプレッション数 - Socialinsiderで取得可能特定の投稿がユーザーに表示された合計回数です。
投稿リーチ数 - Socialinsiderで取得可能特定投稿を見たユニークユーザー数です。
投稿リンククリック数 - Socialinsiderで取得可能特定投稿内のリンクがクリックされた回数です。
エンゲージメント - Socialinsiderで取得可能特定投稿における全エンゲージメント数(いいね、コメント、シェア)です。
投稿別エンゲージメント率(リーチ基準) - Socialinsiderで取得可能投稿のエンゲージメント数(いいね、コメント、シェア)を、その投稿を見たユーザー数で割ったパーセンテージです。
動画・リールの再生数 - Socialinsiderで取得可能動画またはリール投稿がユーザーに再生・視聴された合計回数です。
トップパフォーマンスポスト - Socialinsiderで取得可能最も多くのエンゲージメント、エンゲージメント率、リーチなど主要メトリクスを記録した投稿です。
ワーストポスト - Socialinsiderで取得可能最もエンゲージメントが少ない、エンゲージメント率の低い、リーチが少ないなどの投稿です。
投稿グループ - Socialinsiderで取得可能コンテンツテーマ、投稿形式、エンゲージメントタイプ別(例:様々なリアクション)など、タグ付けとグループ分けによる高度な投稿分析です。
追跡すべきFacebookストーリーズアナリティクスメトリクス
Facebookストーリーズアナリティクスは、ストーリーズのリーチとエンゲージメントを表示します。
ストーリーズは24時間で消えるエフェメラルなコンテンツ(動画、静止画、テキスト等)で、ユーザーのフィード上部に表示されます。ページ投稿と投稿の合間にも、即座に視認性高くオーディエンスとエンゲージできます。
ビジネスページはストーリーズでブランド認知やエンゲージメントを促進可能です。画面内で非常に目立つため、ユーザーはより頻繁にブランドとやりとりし、リアルタイムなコミュニケーションができます。
ストーリーズは写真や動画投稿に比べて低コストでのコンテンツ制作も可能ですが、依然としてビジネス価値が高いため、ストーリーズアナリティクスのモニタリングは重要です。
ストーリーズのリーチ - Metaで追跡ストーリーを見たユニークユーザー数です。
ストーリーのインタラクションストーリーに対するすべてのインタラクション(タップ、スワイプ、返信、リアクション)合計です。
追跡すべきFacebookリールアナリティクス
Facebookリールアナリティクスは、動画の視聴回数、リーチ、エンゲージメントに関するインサイトを提供します。
Facebookリールは3~90秒の縦型(9:16)短尺動画です。ストーリーズよりも没入感とエンタメ性があり、標準的なビデオ投稿ほど高い制作コストを要しません。
ビデオマーケティングは多くのソーシャルメディアプラットフォームで主流となっており、Facebookも例外ではありません。リールはアルゴリズムから優先的に表示され、フォロワー外の人にも届くため、発見性を高めリーチ拡大に強力です。
リールコンテンツは非常にクリエイティブでトレンドドリブンなため、限られた予算でも高インパクトなマーケティング施策に活用できます。うまく作り込めば、バイラルトレンドへの参加から商品・サービスの直接的なプロモーションまで、幅広い用途が見込めます。
リールのポテンシャルを最大化し、トレンドのスピードにも対応するためには、リールアナリティクスを細かく確認してください。
このメトリクスは標準投稿のアナリティクスに似ていますが、初回再生回数や視聴分数など、リール特有のスタイルに合わせた詳細な項目も存在します。
初回再生数 - Metaで追跡リールがユーザーによって初めて再生された回数です。
視聴分数 - Metaで追跡リールが視聴された合計分数です。
インタラクション数 - Socialinsiderで取得可能リールへの総インタラクション数(いいね、コメント、シェア)です。
リールのリーチ - Socialinsiderで取得可能特定リールを見たユニークユーザー数です。
リールのリンククリック数 - Socialinsiderで取得可能特定リール内のリンクがクリックされた合計回数です。
リールのエンゲージメント - Socialinsiderで取得可能特定リールで獲得したエンゲージメント(いいね、コメント、シェア)合計です。
リール別エンゲージメント率 - Socialinsiderで取得可能リール視聴者数に対するインタラクション(いいね、コメント、シェア)の割合です。
追跡すべきFacebookビデオアナリティクスメトリクス
Facebookビデオアナリティクスは、動画投稿の視聴回数、リーチ、エンゲージメントを把握できます。
リールと同様、動画投稿はアルゴリズム上で表示優先度が高く、静的投稿よりも広範囲にリーチし、高いエンゲージメントを獲得しやすいです。
FacebookリールとFacebookビデオの違いは、リールは専用フィードで非フォロワーにも配信される点です。コンテンツのスタイルにも違いがあり、ビデオはリールより長尺でトレンド依存度が低めです。
そのため、ロングフォームのビデオ投稿は複雑なメッセージの発信や、より長い視聴時間でブランドの個性づくりに有効です。例えば、創業者ストーリーや製品紹介などに活用できます。
動画投稿はストーリーズやリールよりも制作コストがかかりがちです。ビデオアナリティクスを活用することで投資効果を最大化できます。
視聴分数 - Metaで確認Facebook上の動画視聴回数は、特定動画が視聴された合計分数(リプレイ分も含む)で確認します。
エンゲージメント - Socialinsiderで取得可能ビデオ投稿に対する全エンゲージメント(いいね、コメント、シェア、リアクション)の合計です。
投稿インプレッション - Socialinsiderで取得可能特定のビデオがユーザーに表示された合計回数(エンゲージメント有無は問わず)です。
ビデオ投稿リーチ - Socialinsiderで取得可能特定ビデオ投稿を見たユニークユーザー数です。
ビデオ投稿のリンククリック数 - Socialinsiderで取得可能特定ビデオ投稿に含まれるリンクがクリックされた回数です。ビデオ投稿別エンゲージメント率 - Socialinsiderで取得可能ビデオ投稿を見たユーザー数に対するエンゲージメントの割合です。
追跡すべきFacebookライブアナリティクスメトリクス
Facebookライブアナリティクスは、ライブ配信のパフォーマンスデータを提供します。
ライブ配信機能を使ってビジネスページがリアルタイムでオーディエンスと交流できます。ライブを開催することで即時のフィードバックや、理想顧客との信頼性ある関係構築が可能です。
ライブは透明性向上や信頼構築に効果的で、新商品発表、Q&A・AMAイベント、ライブイベントの配信、ファン向け舞台裏の公開など幅広く活用できます。
さらに、ライブはアルゴリズム上の表示優先度も高いため、リーチ拡大やエンゲージメント向上に役立ちます。ライブアナリティクスのモニタリングによって、最適かつ魅力的な交流方法を決定できます。
視聴分数 - Metaで追跡Facebookライブが視聴された合計分数です。
エンゲージメント - Socialinsiderで取得可能Facebookライブ中に発生した全エンゲージメント(いいね、コメント、シェア、リアクション)合計です。
ピーク視聴数 - Socialinsiderで取得可能Facebookライブで同時に3秒以上視聴していた最大視聴者数です。
追跡すべきFacebook広告アナリティクスメトリクス
Facebook広告アナリティクスは広告キャンペーンの効果を把握できるため、広告費用とROIの最適化に役立ちます。
企業は効果的なFacebookマーケティング戦略の策定に多大な時間・リソース・予算を投資します。そのため、トラッキングとレポートがとても重要です。特に広告は最大級の投資対象です。
広告アナリティクスのモニタリングにはMetaのAds Managerが最適です。リーチ、インプレッション、成果単価などのメトリクスを詳細に分析することで、理想とするオーディエンスを特定し、ビジネス目標に照らして広告パフォーマンスを追跡し、データドリブンでコンテンツやキャンペーンを調整できます。
広告理解が深まれば深まるほど、成果も向上します。
リーチ - Metaで追跡Facebook広告を見たユニークユーザー数です。
インプレッション - Metaで追跡Facebook広告が何度表示されたかの合計回数(クリック有無を問わず)です。
成果単価 - Metaで追跡Facebook広告による1件あたりの成果またはアクション(例:クリックやコンバージョン)の平均コストです。たとえば広告費用が$100で10件のクリックがあった場合、成果単価は$10となります。
Facebookアナリティクスレポートの読み方
Facebookで利用できる膨大なデータは、両刃の剣です。マーケティング戦略の有効性について貴重なインサイトを得られる一方で、どう整理・分析すべきか迷ってしまうこともあります。
Facebookアナリティクスレポートを読む際、どこから始めればよいのでしょうか。
注目すべきポイントをまとめました。
パフォーマンス追跡:主要メトリクス
Facebookアナリティクスの主な目的は、ご自身のページやコンテンツのパフォーマンスを把握することです。まずは、ビジネス目標に最も関連するKPIに集中しましょう。多くの場合、次の指標が該当します。
- リーチ
- インプレッション
- エンゲージメント
- コンバージョン率
こうしたメトリクスを時系列で追跡することで、戦略の成功を示す傾向やパターンが見えてきます。
オーディエンスのデモグラフィック
次に重要なのは、オーディエンスのデモグラフィックです。これは、自社コンテンツが誰にリーチし、どのようにエンゲージメントされているか、そしてそのオーディエンスが適切かどうかを評価するうえで不可欠です。
年齢、性別、地域、興味関心などが含まれます。これらのインサイトをモニタリングすることで、ターゲットに合わせたメッセージや戦術の調整、新たな機会の発見につながります。コンテンツやキャンペーンが、狙い通りのオーディエンスに届いているか、的確に判断できます。
また、戦略の進化や新しい層へのリーチのチャンスも示唆します。たとえば、地理的な拡大にも活用できます。
コンテンツ最適化
Facebookアナリティクスはコンテンツマーケティングにおいて非常に重要な役割を果たします。ソーシャルメディアのアルゴリズムは日々変化するため、コンテンツが確実に成果を生み出しているか常に注視することが必要です。
定期的な分析・レポーティングで、どのコンテンツ(投稿形式やコンテンツの柱)が最もリーチとエンゲージメントを集めているか確認しましょう。オーディエンスに響くコンテンツを把握し、その情報を元に今後のコンテンツ最適化につなげます。成功したキャンペーンは再現し、効果のない形式は一時的に停止するなど、最適化の判断が可能です。
また、新機能追加やプラットフォーム全体のトレンドに参加するかどうか、その都度柔軟に戦略を調整できるでしょう。
例えば、リールがリーチを伸ばしていることや、ユーモアを交えたコンテンツがフォロワー増加につながる場合もあります。こうしたインサイトを活用すれば、自信を持ってコンテンツ制作に取り組めます。
予算配分
ビジネス向けコンテンツ制作では、時間・スキル・予算が必要です。専門家の採用、素材の調達、広告費へのコミットメントなど、その投資効果を明確に可視化し伝えることが欠かせません。
Facebookアナリティクスを使えば、予算がどこに使われ、望む成果を生み出しているか評価できます。クリック単価やコンバージョン単価などのコスト指標も確認し、ROIを最大化しましょう。これらをステークホルダーと共有することで、マーケティング成果の説得力を高められます。
最も効果的な広告やキャンペーンに合わせて、柔軟に予算配分を調整できます。
戦略の調整
Facebookアナリティクスは、オーディエンスターゲティングやトレンド重視のコンテンツ、広告費など様々な戦術検証のための膨大なデータを提供します。
これらすべてをつなぎ合わせることで、ビジネス目標達成のための全体的な戦略や手法が見えてきます。
パフォーマンス追跡、オーディエンスデモグラフィック、コンテンツ最適化、予算配分から得たインサイトを統合することで、その戦略が本当に機能しているかを判断できます。ブランド認知拡大や売上向上など、各戦術が目標にどう貢献しているかが明確になります。
ここから、変えるべき点と維持すべき点を見極めましょう。Facebookのレポートを活用して、重要なインサイトや学びをチーム全体で共有し、データドリブンな意思決定によってコンテンツ強化、ターゲティング向上、キャンペーンの洗練化など、より効果的な戦略づくりにつなげてください。
Facebookで投稿アナリティクスを確認する方法
Facebook投稿のアナリティクスは、ビジネスのパフォーマンスを即座に把握できる最も手軽な方法の一つです。週単位、場合によっては毎日、投稿データをチェックしたくなるでしょう。ここではその方法をご紹介します。
#1. Facebookのページインサイトで
ページインサイトで投稿のアナリティクスを確認するには、次の手順に従ってください。
- Facebookアカウントにログインし、フィードから「プロフェッショナルダッシュボード」をクリックするか、管理しているページに移動して「管理」をクリックします。
- プロフェッショナルダッシュボードに入ったら「あなたのページ」に移動し、投稿のリーチやエンゲージメントの概要を確認できます。
- さらに詳細を確認したい場合は、「コンテンツ」で詳しい内訳を見ることができます。
#2. Meta Business Suiteで
Meta Business Suiteでは投稿ごとの詳細なデータを取得できます。Instagramコンテンツとも比較可能です。
Meta Business SuiteでFacebook投稿のアナリティクスを確認するには、以下の手順に従ってください。
- Facebookにログインし、右上のプロフィール写真をクリックします。
- 「すべてのプロフィールを表示」を選択し、確認したいページを選びます。
- 左側メニューからMeta Business Suiteに移動します。
- 「インサイト」をクリックし、「コンテンツ」までスクロールします。
- 全体のメトリクス(例:メディアタイプごとの投稿の中央値リーチ)を見る場合は「概要」をクリック。投稿ごとのメトリクス(リーチ、リアクション、コメント、シェア)を見る場合は「コンテンツ」をクリックします。
#3. Socialinsiderを使う方法
Socialinsiderは、さらに高度なFacebookアナリティクスを提供。パフォーマンスをより専門的かつ詳細に理解できます。
SocialinsiderでFacebook投稿のアナリティクスを確認するには、次の手順に従ってください。
- Socialinsiderアカウントにサインアップまたはログインしてください。
- プロジェクトを選択または作成し、分析したいFacebookページを選択または接続します。
- 必要なデータに応じて、左側サイドバーの各セクションを切り替えてください。「コンテンツ」では投稿状況の概要(投稿の配信数、投稿時間、トップ投稿・ボトム投稿)が確認できます。「投稿」や「動画」では各投稿ごとの詳細なメトリクス(リーチ、インプレッション、エンゲージメント、ビューなど)が閲覧可能です。
GoogleアナリティクスでFacebookからのトラフィックを追跡する方法
あなたのFacebookページは、ブランド認知、リード獲得、もしくは商品やサービスの獲得チャネルとして活用していますか?それなら、Facebookマーケティングがどれだけウェブサイトのトラフィックにつながっているか、しっかり把握しましょう。
下記の手順で、Googleアナリティクス(GA)を使ってFacebookページからのウェブサイトトラフィックを追跡できます。
1. Google Campaign URL BuilderでUTMパラメータを設定
まず、共有したいリンクにUTMパラメータを設定します。これにより、GAでFacebookからのトラフィックを正確に確認できます。
Google Campaign URL Builderを使って、ウェブサイトリンクにUTMパラメータを追加してください。ソース、メディア、キャンペーン名、キーワード、コンテンツといった各項目を入力して、主要な情報を追跡できます。
例:utm_source=facebook、utm_medium=social、utm_campaign=[campaign_name]など。
2. カスタムURLを投稿に追加
各項目を入力すると、Googleがカスタムで追跡可能なURLを生成します。そのURLをコピーし、Facebook投稿に貼り付けてください。
リンクを短縮したい場合は、Bitlyのようなツールを利用できます。
3. Googleアナリティクスでトラフィックを計測
GAにログインし、「レポート」>「集客」>「トラフィック獲得」に進みます。
ここで、自社のコンテンツやキャンペーンによるトラフィックを確認できます。セッション数、直帰率、コンバージョンなどの指標も確認可能です。
ドロップダウンメニューで設定したUTMパラメータ(セッションメディア、セッションソース、セッションキャンペーンなど)に応じて表示を切り替えられます。
4. パフォーマンスを分析
GAは、Facebookマーケティングがウェブサイトやランディングページにもたらすトラフィックを表示し、他の流入元(例:メールやInstagram)と比較できます。これらのインサイトを活用し、レポートを作成して戦略を最適化しましょう。
Facebookアナリティクスはまだ利用できますか?
Facebookアナリティクスとは、ビジネスページやプロフィールのオーディエンスとパフォーマンスデータを追跡できる純正ツールの名称でした。2021年7月以降、このツールは利用できなくなりました。
現在は、FacebookページインサイトやMeta Business Suite、またはSocialinsiderのようなサードパーティツールでFacebookアナリティクス(ビジネスページのメトリクスやデータ)を確認できます。
Facebookでデータアナリティクスはどのように活用されていますか?
一般的に、Facebookはデータアナリティクスを活用してユーザー行動やキャンペーンパフォーマンスを追跡しています。
Metaは、プラットフォーム内外のユーザーからデータを収集し、クッキーでオンライン行動を追跡、行動記録の情報を保持しています。
収集したデータは、コンテンツのパーソナライズ、新しい機能の開発、ユーザーの安全確保、広告ターゲティング、プラットフォームの最適運営に利用されます。
ビジネスページ管理者も、アナリティクスを通じて同様のデータ活用が可能です。Facebookの標準インサイト機能、Meta Business Suite、Socialinsiderのようなサードパーティツールで、主要パフォーマンスメトリクスの追跡やオーディエンスインサイトの活用、ソーシャルメディア戦略の最適化ができます。
Facebookアナリティクスデータのエクスポート方法
Facebookマーケティングのカスタマイズレポートを作成したい場合、Meta Business Suiteまたは他のツールからFacebookアナリティクスデータをエクスポートできます。
SocialinsiderではFacebookインサイトをCSV、PPT、PDF、XLSなど複数フォーマットでエクスポート可能です。GoogleのLooker Studioへのデータインポートも対応しています。
Socialinsider内ではデータダウンロードのスケジュール設定ができ、Facebookレポート業務を自動化できます。ブランドカラーや会社ロゴを追加し、Facebookアナリティクスレポートを柔軟にカスタマイズ可能です。
Facebookのベンチマークデータを取得する最も簡単な方法です。
競合他社のページを追加して、自社のパフォーマンスを比較できます。無料トライアルを開始してください。