Analytics LinkedIn plus poussés que les insights natifs
Socialinsider offre aux entreprises des insights approfondis sur l'engagement et la performance LinkedIn dans une plateforme simple à utiliser.
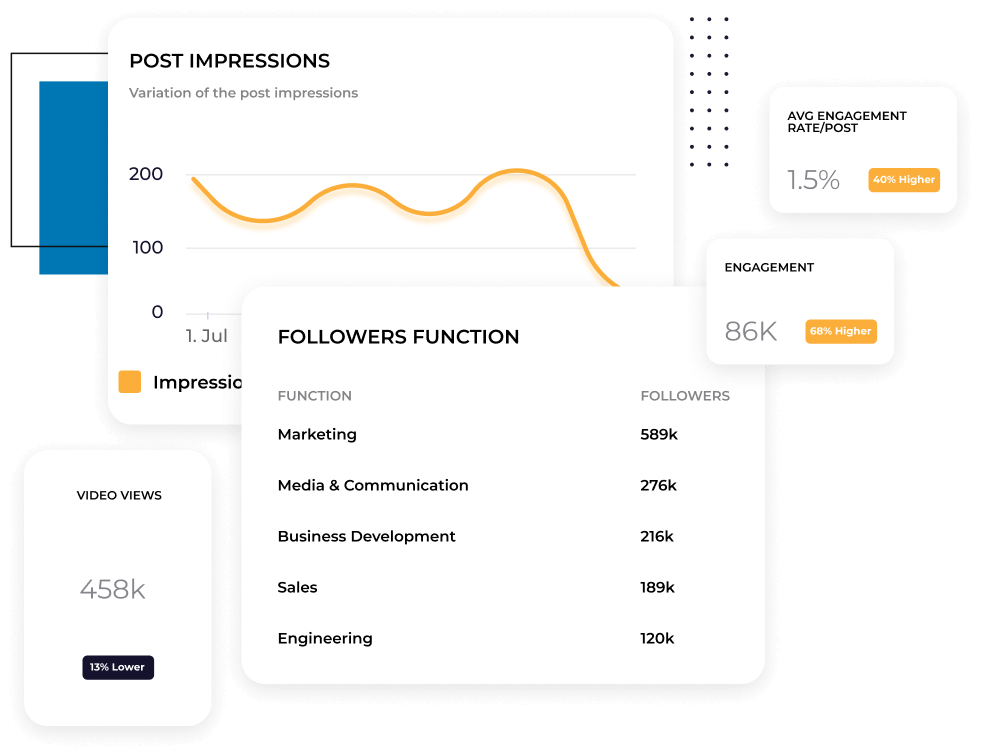


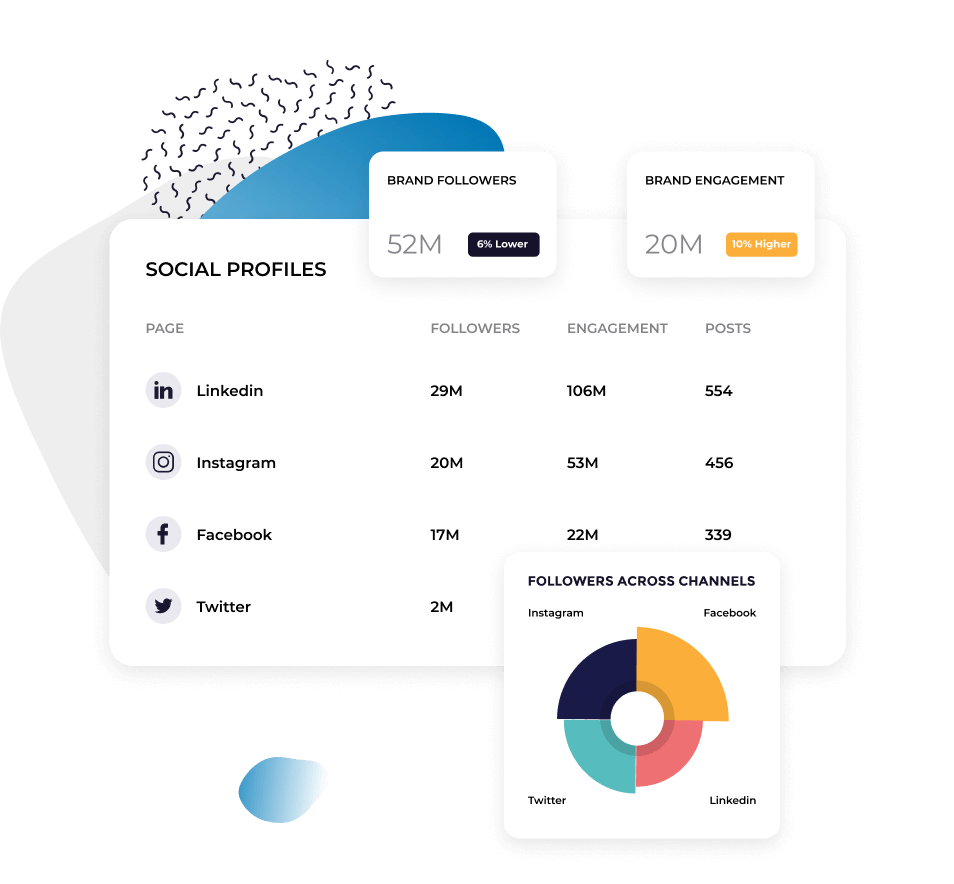
Toutes tes métriques LinkedIn dans un seul dashboard
Suis l'engagement, les impressions, les clics, les vues vidéo et la croissance des abonnés en un seul endroit. Inutile de passer des analytics LinkedIn aux tableurs. Analyse la performance de ton contenu sur plusieurs jours, semaines ou mois sans devoir tout recommencer à chaque fois.
Découvre ce qui fonctionne au niveau des publications
Les métriques au niveau du compte donnent des moyennes. Les analytics au niveau des publications montrent quels formats, sujets et styles de message engagent ton audience. Repère les tendances de ton contenu pour miser sur ce qui fonctionne.

"On a commencé à utiliser Socialinsider pour réaliser des analyses concurrentielles complètes."

Sache exactement qui ton contenu atteint
Comprends les attributs de ton audience comme le poste, le secteur et la taille de l'entreprise. Découvre si ton contenu touche les décideurs que tu vises ou attire la mauvaise audience. Socialinsider t'offre le niveau de détail dont tu as besoin pour ajuster.
Compare les métriques LinkedIn à tes autres canaux
Découvre comment LinkedIn se compare à tes autres plateformes social media dans une vue cross-canal. Vois où l'engagement est le plus fort, où la croissance va le plus vite, et repère où tu investis trop ou pas assez.
Ce qu'ils disent de nous
"Le service client est aussi l'une de mes fonctionnalités préférées. Vous êtes tout simplement phénoménaux. Ton équipe est très réactive, accueillante et serviable. Ce n'est pas la norme."

"Socialinsider nous a permis de voir si on progresse ou régresse, surtout par rapport aux autres comptes qu'on suit."

"Socialinsider te permet d’analyser tes concurrents et de comparer tes performances par rapport au marché."

"L’analyse de sentiment pour les hashtags Instagram est incroyable. Ce nouveau dashboard social media listening m’a aidé à planifier sur le long terme."

"Nous utilisons ce dashboard analytics social media pour tous nos 40 clients social media. Toutes les données de performance sont regroupées au même endroit."

"Avec Socialinsider, notre équipe est devenue plus efficace. Plus besoin de perdre du temps à collecter des données social media. On peut se concentrer sur les insights et l'analyse."

"On utilise Socialinsider pour les insights social media au quotidien, si on veut définir des changements stratégiques simples ou analyser les performances de certaines publications."

"En moyenne, un rapport social media pour une marque prend 1 à 2 heures de travail avec Socialinsider. Avant, il fallait une journée entière pour rassembler les données."

"Socialinsider nous a permis d’économiser plus de 16 000 $ par an. Tu gagnes du temps sur les rapports mensuels et les analyses complexes sur le long terme."

Comment suivre le taux d'engagement LinkedIn dans Socialinsider
Les analytics social media et les outils d'analyse de concurrents de Socialinsider te permettent de mesurer la performance social media, d'auditer et de comparer les résultats.
Commence par créer un compte d’essai sur Socialinsider.
Connecte les profils que tu gères
Récupère toutes les métriques d'engagement pour n'importe quel compte LinkedIn professionnel
Analyse les données des publications passées
Réalise une analyse cross-canal pour évaluer tes performances LinkedIn.

Obtiens des insights concurrentiels et explore
les social media analytics metrics
Questions fréquentes
Tu as une question ? On a les réponses.
Que sont les analytics LinkedIn ?
Les analytics LinkedIn sont des données et insights qui t'indiquent la performance de ta page entreprise LinkedIn. Tes analytics LinkedIn regroupent des métriques liées à ton audience, à ton contenu, à la portée, aux campagnes publicitaires et plus encore.
Voici quelques métriques précises que tu peux consulter dans tes analytics LinkedIn :
- Vues de la page : Le nombre de fois où ta page entreprise a été consultée
- Abonnés : Le nombre d'abonnés de ta page
- Impressions des publications : Le nombre de fois où ta publication a été vue
- Réactions : Le nombre de réactions (j'aime, soutiens, félicitations) reçues sur ta publication
- Clics : Le nombre de clics sur un lien dans ta publication
Tu peux aussi suivre l'évolution de ta croissance et de tes performances avec des graphiques. Cela te permet de voir si ton nombre d'abonnés, la performance de tes publications et d'autres KPIs s'améliorent dans le temps.
En surveillant tes analytics LinkedIn, tu t'assures que ta page progresse, que tes publications résonnent auprès de ton audience et que ta stratégie LinkedIn marketing fonctionne.
Pourquoi suivre tes analytics LinkedIn ?
Voici la grande question : pourquoi t'embêter à suivre les analytics LinkedIn ?
Pourquoi sont-ils importants ?
Qu'est-ce qu'ils peuvent vraiment apporter à ton équipe marketing pour faire la différence ?
Suivre tes analytics LinkedIn offre quatre avantages majeurs à ton entreprise.
Apprends à mieux connaître ta cible
Les analytics LinkedIn te donnent accès à des données sur les visiteurs de ta page (ceux qui consultent ta page entreprise) et sur tes abonnés (ceux qui te suivent réellement).
Ces données incluent notamment :
- Localisation
- Secteur d'activité
- Taille de l'entreprise
- Titre de poste
- Séniorité
Tu comprends ainsi plus facilement qui compose ton audience et tu t’assures de cibler les bonnes personnes.
Par exemple, si tu vises les fondateurs B2B et que la majorité de tes abonnés sont débutants, il faut ajuster ton message pour attirer une autre audience.
Une fois que tu cibles les bonnes personas social media, utilise leurs données démographiques pour mieux cerner leurs attentes. Analyse la performance de tes publications pour savoir quel type de contenu leur plaît le plus.
Ces données t’offrent une vision claire de qui compose ton audience et de ce qu'elle attend de ton entreprise.
Améliore ta content strategy
Les analytics ta page entreprise LinkedIn te tiennent informé.e des performances de tes publications : reach, impressions, réactions, commentaires, partages et plus encore. Voir combien de personnes voient et interagissent avec tes contenus t’aide à comprendre quels formats fonctionnent le mieux auprès de ton audience.
Sur LinkedIn, tu peux poster plusieurs formats :
- Publications texte seules et informatives
- Posts illustrés
- Vidéos
- Diaporamas PDF
Retrouves-tu des tendances dans tes analytics LinkedIn ? Quels types touchent l’audience la plus large et boostent l’engagement ?
En misant sur ces contenus, tu continues de grandir, tu améliores ta content strategy, et tu augmentes ton reach, ton engagement et ton ROI LinkedIn.
Génère un meilleur ROI LinkedIn
Mais surtout, le principal avantage à suivre tes analytics LinkedIn, c’est d’optimiser ton ROI (retour sur investissement).
Regarde les choses en face : si tu ne suis pas les métriques de tes posts organiques et sponsorisés, tu ne sauras jamais si les résultats sont là. Si tu ignores la réaction de ton audience, tu publies des contenus sans savoir si cela touche vraiment ta cible.
Au final, le but du marketing LinkedIn, c’est de toucher ta cible et de la convertir en client. Suis les performances de tes publications pour générer un ROI positif. Adapte ta stratégie selon leurs résultats, et tu verras ton ROI s’améliorer.
Comment accéder aux analytics LinkedIn ?
There are two main ways of getting LinkedIn analytics data for your company page, and we’re going to walk you through each one.
How to access your LinkedIn business page analytics via the native app
Firstly, LinkedIn offers its own built-in analytics for you to check out. These are basic stats that help give you a level one understanding of how your company page is doing.
To access your LinkedIn analytics directly on LinkedIn, head over to your company page and check out your Dashboard.
Your dashboard summary shows you details like:
- A few actionable insights
- Your recent posts
- Top key metrics like search appearance, page visitors, new followers, and impressions
- Trending employee posts
Your Analytics dashboard breaks up your LinkedIn page data into sections like:
- Content: Metrics that share the effectiveness of your posts
- Visitors: Demographics and sources of your page visitors
- Followers: Demographics and sources of your page followers
- Leads: Download leads you’ve collected from lead generation forms you’ve shared on LinkedIn to upload to your CRM
- Newsletters: If you have a LinkedIn newsletter, track performance (i.e., subscribers, views) here
- Competitors: Compare basic page details with your competitors
- Employee advocacy: Get insights into content recommended to employees
Many companies are satisfied with the level of analytics they receive from their LinkedIn pages. However, there’s another way to access even more analytics if you’re looking to dive even deeper.
How to access your LinkedIn analytics using a third-party analytics platform like Socialinsider
If you want to dive even deeper into your LinkedIn analytics, do so with the help of a third-party analytics platform. Socialinsider is the perfect solution.
Start by creating a Socialinsider account—if you haven’t done so already. Log in and connect your LinkedIn page so you can view your own data within the Socialinsider dashboard.
To do so, click Connect social accounts at the top of your home dashboard. You’ll then need to log in with your LinkedIn credentials so that you can get full social media analytics access inside Socialinsider.
The LinkedIn analytics you get using Socialinsider include:
- A summary report that you can customize by adding as many different metrics as you want. These will be available at a glance before diving into deeper reports.
- A content report that walks you through data like the number of posts you’ve shared in a given time period, your average posts/day, posts by type, top posts, and even the worst performing posts so you can find patterns.
- Engagement insights that showcase metrics like total engagements (i.e., likes, comments, shares) alongside KPIs like engagement rate (with or without clicks), average engagement, post types sorted by engagement, and more. You can even see the best day and time to post based on your average engagement. Plus, break down individual engagements, like comments, shares, clicks, and video views.
- Reach insights that share basic data on how many people you’ve reached with your LinkedIn content within a given time period.
- Impressions data that lets you see how many people have seen your content and find the best day and time to post based on your average impressions.
- An audience demographics report that lets you see analytics like follower count and growth, geographical distribution of your followers, and details about your followers at work.
- A section about your LinkedIn posts that give you a birds eye view of your recent posts in order of how well they performed, plus basic engagement metrics for each one.
- A head-to-head comparison dashboard that lets you analyze other company pages from a different region into your Socialinsider dashboard.
- Campaign reports based on posts you’ve tagged inside your Socialinsider account as being part of a specific campaign and their overall performance.
You can also download any and all of these LinkedIn analytics reports by clicking Download in the top right corner to share your LinkedIn page analytics with other team members. Formats available include CSV, PPT, PDF, and XLS. You can import LinkedIn data to Google’s Looker Studio, too.
Quelles métriques LinkedIn dois-tu suivre ?
Il existe de nombreux indicateurs LinkedIn à suivre pour comprendre pleinement les performances de ton contenu et savoir si tu dois ajuster ton activité sur LinkedIn ou ta stratégie globale.
Identifier les meilleurs indicateurs LinkedIn pour tes contenus t’aide à voir si ta stratégie fonctionne ou non. Plusieurs catégories d’analytics t’aident à comprendre différents aspects, comme la performance de tes contenus, qui compose ton audience, et plus encore.
Ces catégories incluent :
- Analytics contenu
- Analytics visiteurs
- Analytics abonnés
- Analytics leads
- Analytics newsletter
- Analytics concurrents
- Analytics advocacy employés
- Analytics trafic LinkedIn
On va parcourir les différentes analytics de profil LinkedIn que tu peux suivre, détaillées par catégorie.
Analytics contenu
Les analytics contenu LinkedIn concernent la performance de tes publications LinkedIn, individuellement et dans l’ensemble. Ta stratégie LinkedIn repose sur la performance organique de ton contenu, alors il existe de nombreux indicateurs et KPIs à suivre.
Heureusement, Socialinsider peut vraiment t’aider. Voici quelques-uns des indicateurs LinkedIn les plus importants à suivre, tous disponibles dans ton dashboard Socialinsider.
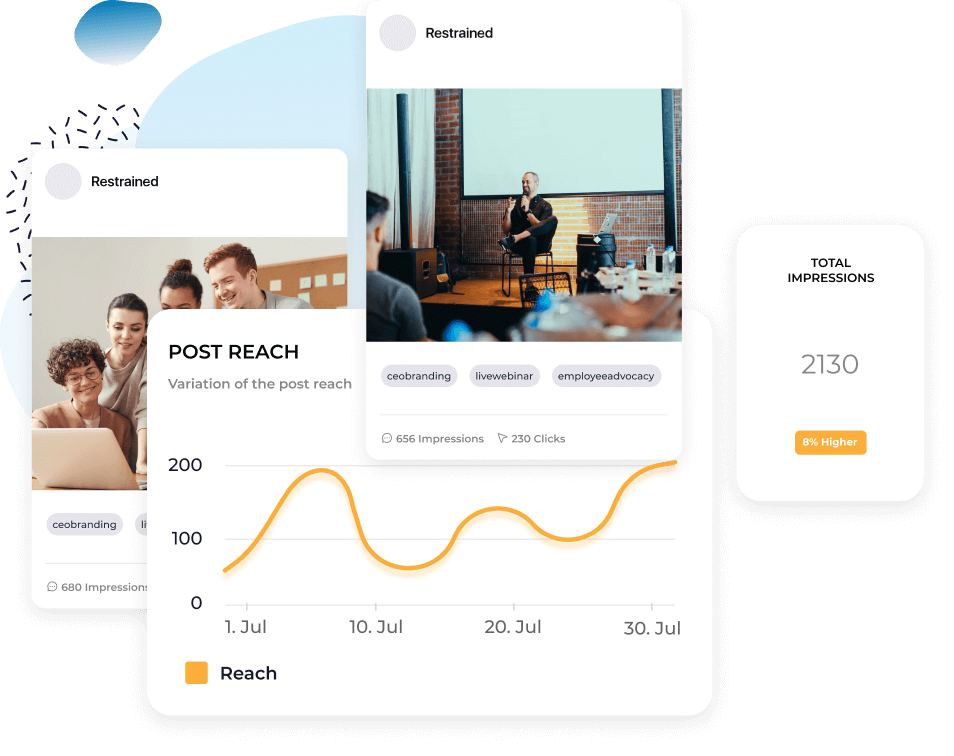
Reach (disponible dans Socialinsider)
Reach est le nombre de personnes qui ont vu ton contenu LinkedIn. Il s’agit du nombre de spectateurs uniques de chaque publication LinkedIn.
Savoir combien de personnes chaque publication atteint t’aide à mesurer la performance de ton contenu face à l’algorithme LinkedIn. Idéalement, ton reach est égal ou supérieur à ton nombre d’abonnés LinkedIn.
À noter : Si tu consultes cet indicateur dans l’analytics native de LinkedIn, il est appelé « impressions uniques » au lieu de reach.
Impressions (disponible dans Socialinsider)
Impressions désigne le nombre total de fois où ta publication a été affichée. Ce chiffre peut être supérieur au reach car il additionne toutes les vues, et pas seulement les personnes uniques. Par exemple, si quelqu’un voit ton post deux fois, cela comptera pour un dans le reach, mais deux dans les impressions.
Tu veux que tes impressions dépassent ton reach, car cela signifie que les gens reviennent consommer ton contenu, ce qui prouve qu’il intéresse ton public.
Engagement (disponible dans Socialinsider)
Engagement correspond au nombre d’interactions avec ton contenu. Sur LinkedIn, cela inclut :
- Likes/réactions
- Commentaires
- Reposts
- Clics sur les liens
- Vues vidéo
- Abonnements
Si tu publies sans obtenir d’engagement, il faut revoir ta stratégie contenu. Si les gens ne réagissent pas ou ne commentent pas, c’est que tes contenus ne les touchent pas. Teste différents formats jusqu’à générer de l’engagement.
Clics (disponible dans Socialinsider)
Les clics sont le nombre de fois où quelqu’un a cliqué sur ta publication LinkedIn. Cela inclut les clics sur des liens, sur le contenu pour lire plus, vers ta page entreprise, ou sur un document partagé.
Avec Socialinsider, tu accèdes aux données d’engagement avec ou sans clics. En effet, ces données sont accessibles seulement si tu relis un compte LinkedIn autorisé que tu gères.
De cette façon, tu peux comparer précisément certaines métriques d’engagement (ex : taux d’engagement sans les clics, taux d’engagement avec clics), afin d’étudier la concurrence ou pour ton usage interne.
Réactions (disponible dans Socialinsider)
Sur LinkedIn, les réactions recensent les façons de réagir à un post. Au départ, seul le « like » existait. Aujourd’hui, tu as aussi :
- Like
- Bravo
- Soutenir
- J’adore
- Stimulant
- Drôle
Beaucoup se contentent d’un « like », mais proposer d’autres réactions t’indique comment ton contenu est perçu. Et laisser une réaction autre qu’un like prend plus de temps, preuve d’un engagement supplémentaire sur ta publication.
Commentaires (disponible dans Socialinsider)
Commentaires indique combien de personnes ont commenté tes publications LinkedIn. Tu veux voir ce chiffre progresser avec ton audience.
Pour booster ton nombre de commentaires, termine chaque post LinkedIn par une question. Lance le débat sur le sujet de ton post pour stimuler ton audience.
Reposts (disponible dans Socialinsider)
Reposts (ou partages) correspond au nombre de fois où quelqu’un a partagé ou repartagé ton post sur son profil ou la page de son entreprise. Grâce aux reposts, tu touches de nouveaux publics, donc cherche à multiplier ces partages.
Commence par inciter tes collaborateurs à repartager tes contenus (on en reparle dans la section analytics advocacy employés) et continue à publier des contenus que ton audience apprécie.
Engagement rate (disponible dans Socialinsider)
Engagement rate : divise le total des engagements par le total d’abonnés, le reach ou les impressions (puis multiplie par 100 pour obtenir le pourcentage). Les trois modes de calcul du taux d’engagement sont accessibles dans ton dashboard Socialinsider pour bien jauger l’engagement de ton audience.
Top-performing posts triés par engagement (disponible dans Socialinsider)
Dans la section Posts de Socialinsider, retrouve la liste de tes meilleurs posts indexés par engagement. Tu peux les trier aussi par :
- Engagement rate
- Date
- Engagement/impressions rate
- Impressions
- Clics
- Vues
Encore une fois, identifie les tendances pour voir quels types de posts restent tout en haut, quel que soit le tri utilisé.
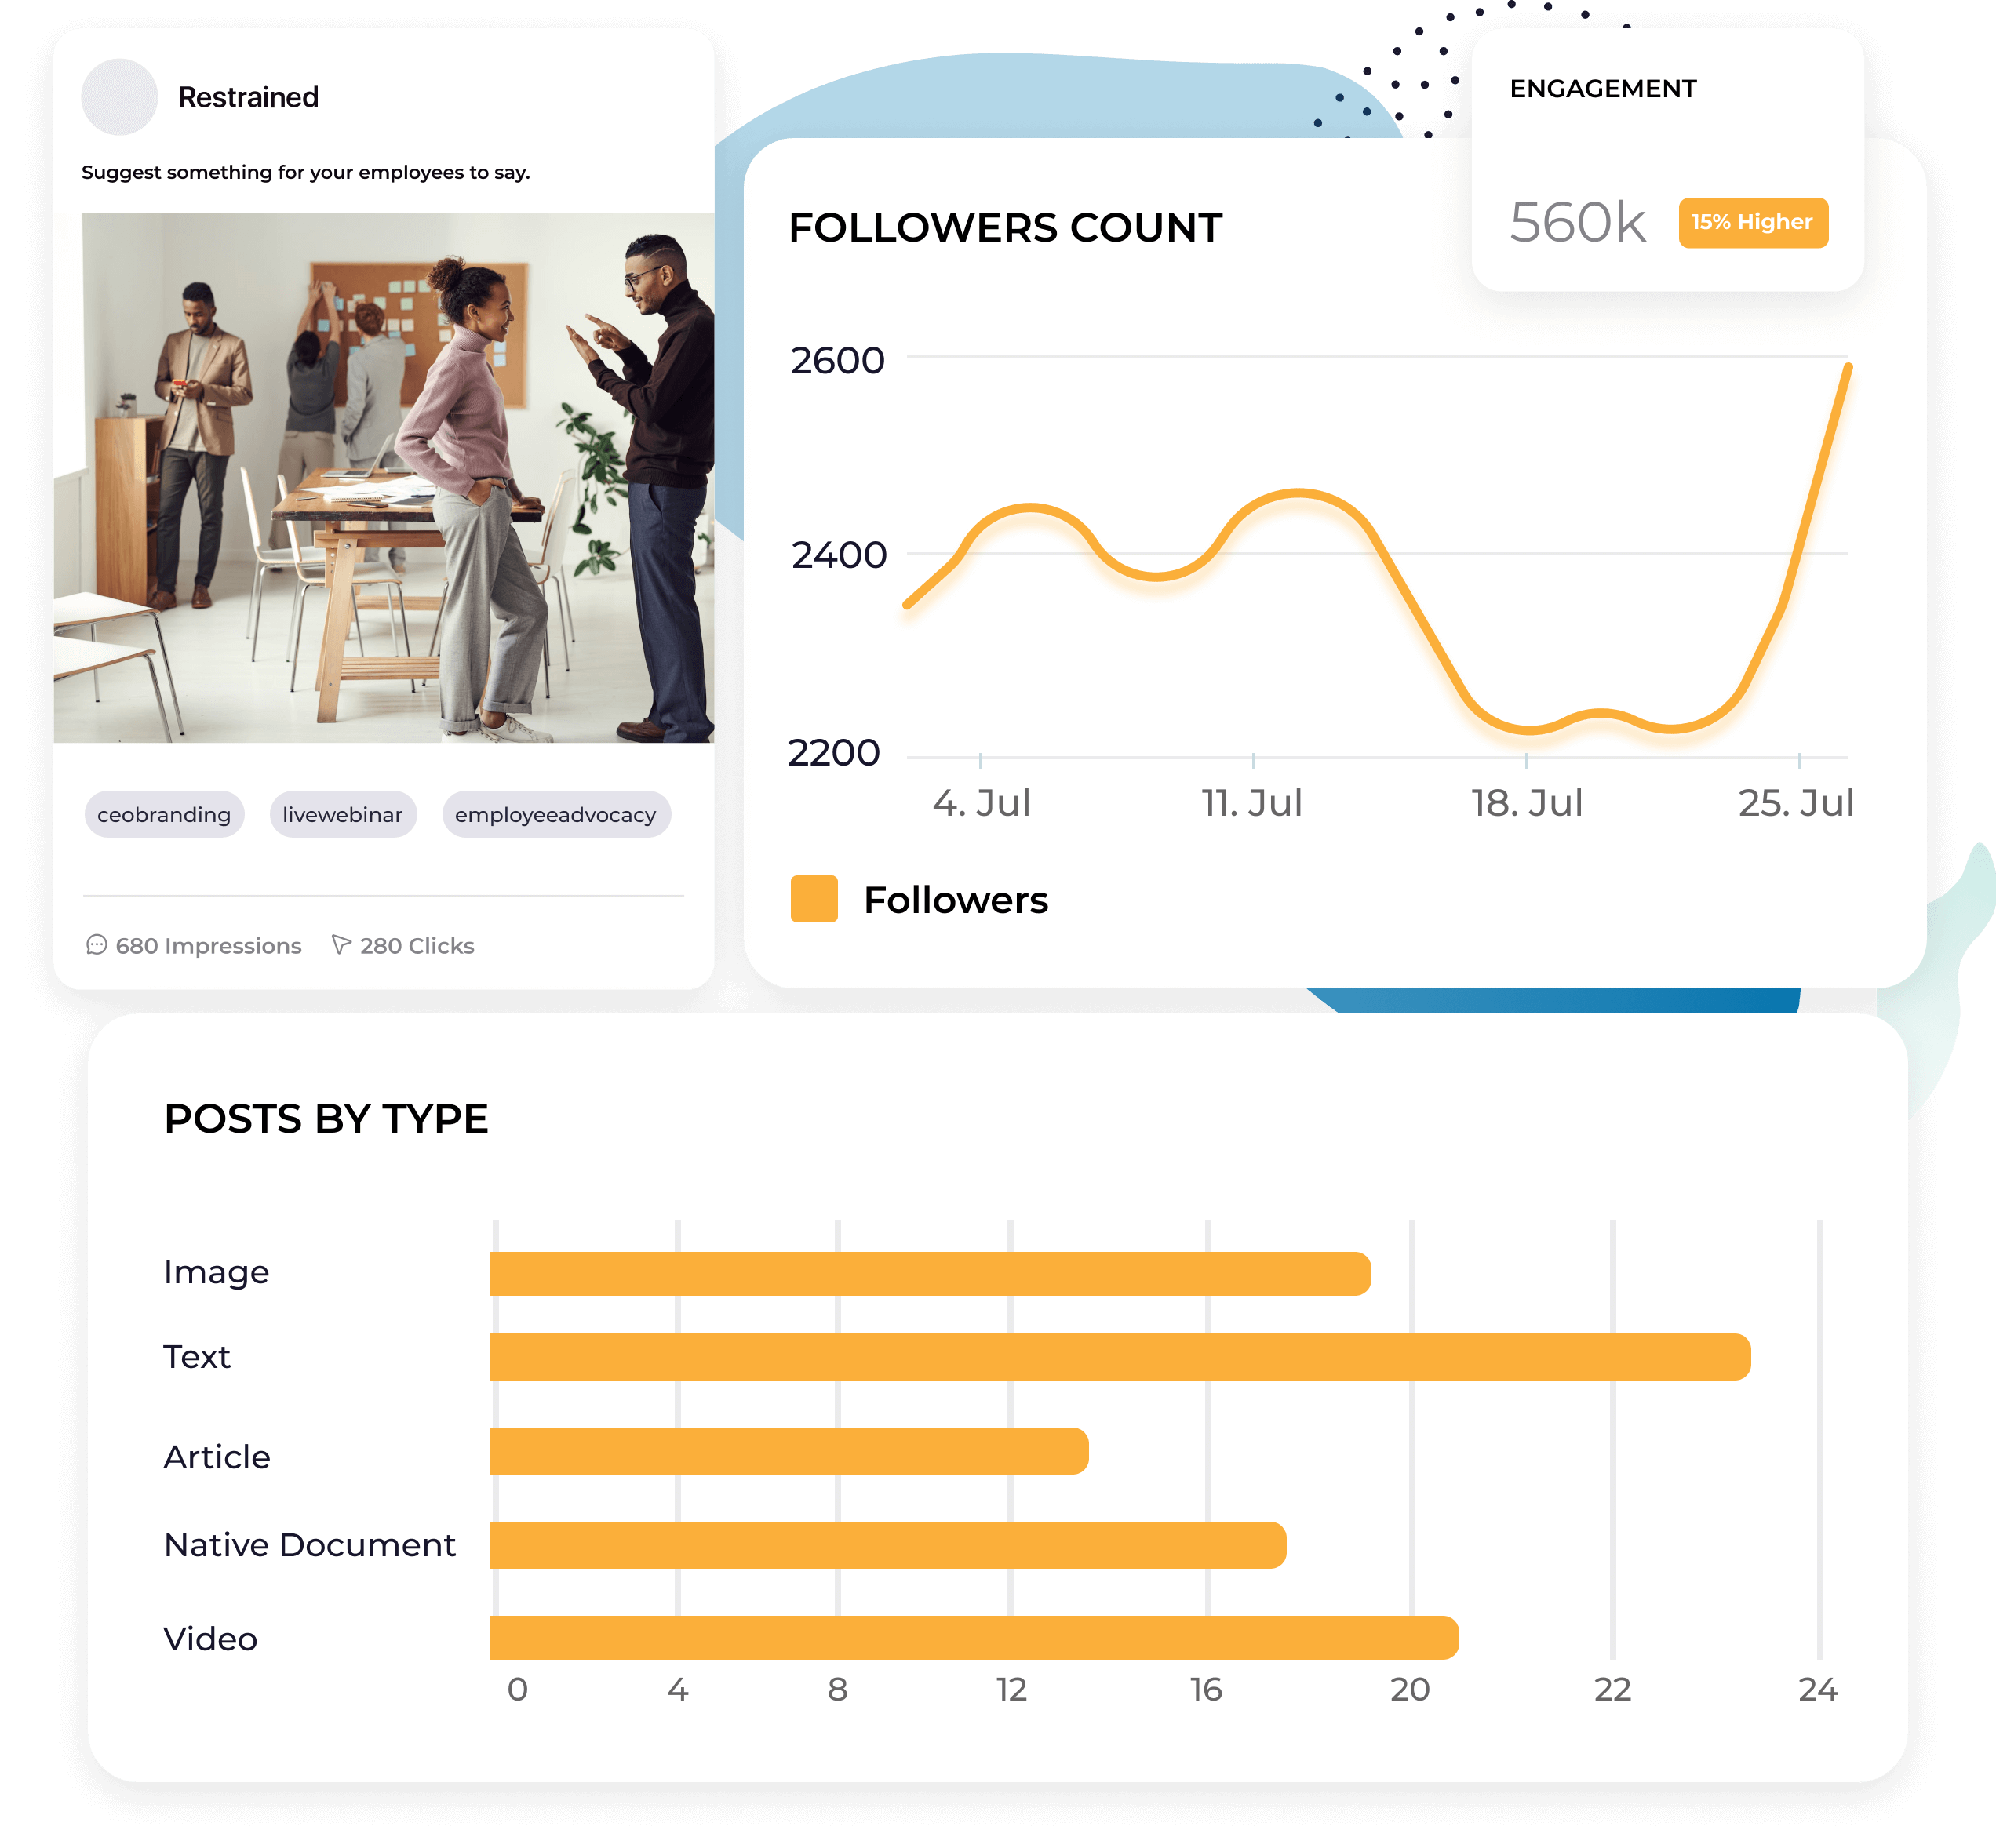
Formats de contenu triés par impressions (disponible dans Socialinsider)
Sous l’onglet Impressions de tes insights Socialinsider, tu as accès au graphique Types de post par impressions. Tu vois alors quels formats (ex : partages de liens, images, vidéos, sondages, documents natifs, texte, carrousels) génèrent le plus d’impressions et peux en publier davantage du même type.
Vues vidéo (disponible dans Socialinsider)
Dans l’onglet Engagement de Socialinsider, fais défiler jusqu’aux métriques vidéo—les vues vidéo étant l’une des plus importantes.
Les vues vidéo t’indiquent combien de fois tes vidéos ont été vues. Sur LinkedIn, une vue vidéo est comptabilisée après au moins trois secondes de visionnage. Si quelqu’un regarde ta vidéo plusieurs fois, chaque visionnage est compté.
Tu peux aussi obtenir des indicateurs comme :
- Vues moyennes par vidéo
- Temps de visionnage total
- Temps de visionnage moyen par vidéo
Analyse des content pillars (disponible dans Socialinsider)
Les content pillars sont les grands thèmes autour desquels ton business publie du contenu. Avec Socialinsider, tu peux taguer facilement tes posts dans différentes campagnes selon le content pillar. Fais-le via l’onglet Campagnes de ton dashboard.
Ça te donne des insights sur les content pillars les plus performants. Certains sujets fonctionnent mieux sur LinkedIn, d’autres sur d’autres plateformes. Adapte ta content strategy en conséquence.
Poursuis avec les analytics visiteurs pour apprendre qui consulte ta page entreprise LinkedIn. Retrouve ces données dans ton analytics native LinkedIn.
Découvrons chaque section des métriques visiteurs sur LinkedIn pour mieux comprendre les données accessibles—et leur impact pour ta stratégie.
Analytics visiteurs
Le résumé visiteurs t’offre trois insights clés :
- Pages vues : Nombre de fois où ta page entreprise a été vue
- Visiteurs uniques : Nombre de personnes uniques ayant visité ta page
- Clics bouton personnalisé : Si tu as configuré un bouton personnalisé en haut de ta page, cela indique combien de fois il a été cliqué pendant la période d’analyse
Cette section donne une vue d’ensemble idéale de la performance de ta page entreprise.
Métriques visiteurs
Tu y retrouves les métriques visiteurs selon le trafic de ta page. Filtre les périodes pour voir le graphique évoluer. Consulte aussi le nombre de personnes ayant exploré tes différentes sections de page ainsi que les pages vues et les visiteurs uniques.
Démographie visiteurs
Ici, apprends-en plus sur le profil type de tes visiteurs via leurs données démographiques LinkedIn.
Découvre des détails comme :
- Fonction
- Localisation
- Séniorité
- Secteur
- Taille d'entreprise
Cela t’aide à vérifier si tu touches la bonne cible avec tes contenus.
Trafic des pages Life
Les Life pages sont des pages personnalisées pour partager la culture d’entreprise avec les candidats LinkedIn. Montre ce que tu fais, qui travaille avec toi, et plus encore. Idéal pour attirer des talents.
Et tu obtiens des insights dédiés sur la performance de ta page Life dans l’onglet Visiteurs. Accède aux indicateurs comme le nombre total de visiteurs et de visites uniques pour vérifier l’intérêt pour la page Life publique.
Analytics abonnés
Le troisième onglet du dashboard analytics LinkedIn te renseigne sur ceux qui ont cliqué sur le bouton S’abonner et qui suivent activement ta page.
Découvrons les différentes métriques abonnés disponibles dans l’outil analytics LinkedIn.
Résumé abonnés
Obtiens un aperçu rapide de tes abonnés LinkedIn dans l’espace résumé. Tu trouves :
- Abonnés totaux : Nombre total d’abonnés de ta page
- Nouveaux abonnés : Croissance d’abonnés sur les 30 derniers jours et le pourcentage de croissance
Métriques abonnés
Ici, accède à un graphique montrant l’évolution de ta courbe d’abonnés sur une période. Cette courbe connaît des hauts et des bas, mais tu veux voir une tendance globale à la hausse.
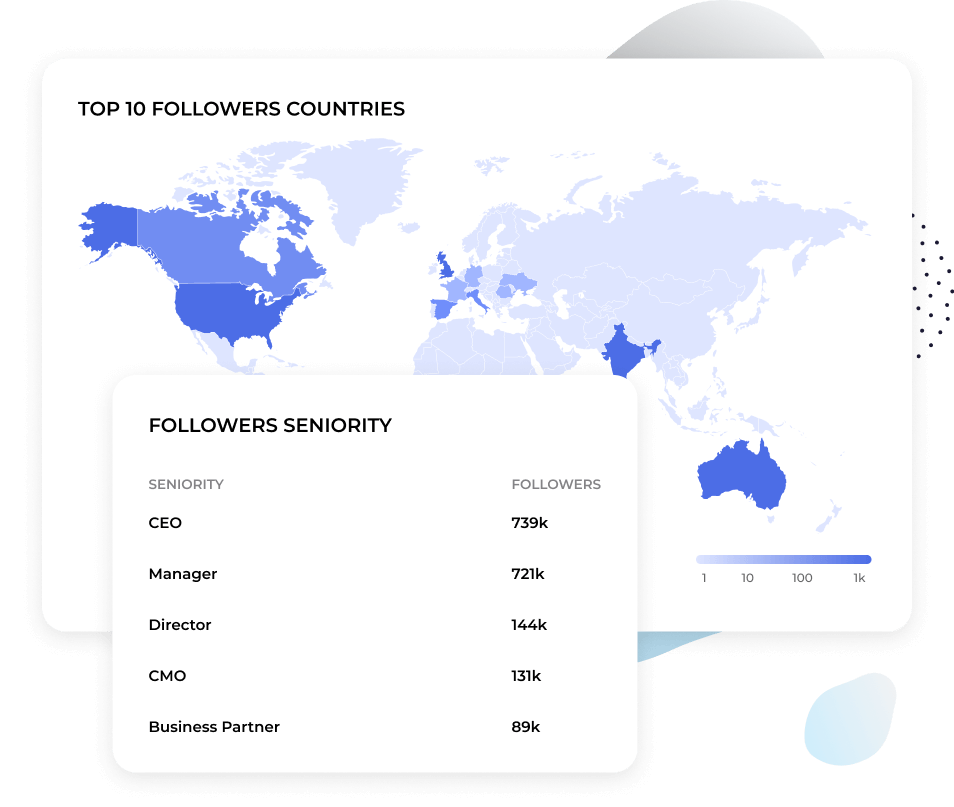
Démographie abonnés
Cette section propose des datas similaires à la démographie visiteurs. Découvre qui te suit selon leurs critères LinkedIn. Tu vois :
- Fonction
- Localisation
- Séniorité
- Secteur
- Taille d'entreprise
Tous les abonnés
Retrouve la liste de tes abonnés avec certaines infos clés, et la date à laquelle ils ont suivi ta page, classés par ordre de nouveauté.
Analytics leads
Comme LinkedIn est un réseau professionnel, tu peux générer des leads et accéder à un rapport analytics dédié pour suivre la génération de leads.
Tu y suis chaque campagne de génération de leads, sa date de création, son statut actuel et combien de leads elle a généré. Télécharge alors le fichier complet pour intégrer les leads à ton CRM et commence à les nourrir.
Analytics newsletter
Si ton entreprise a lancé sa propre newsletter LinkedIn, consulte cette section sur la plateforme analytics LinkedIn—elle t’aide à évaluer la performance de ta newsletter.
Voyons ensemble les sections disponibles dans le rapport analytics newsletter LinkedIn.
Tendances
Analyse les tendances de ta newsletter selon la période. Les métriques à retrouver ici :
- Vues d’article : Nombre de fois que tes contenus newsletter ont été vus
- Nouveaux abonnés : Nombre de nouvelles personnes abonnées à ta newsletter
Un graphique en courbe t’aide à visualiser la croissance.
Totals articles
Accède ici aux indicateurs clés issus de ta newsletter, comme :
- Impressions : Nombre total de consultations de ta newsletter
- Engagements : Nombre total d’engagements reçus par ta newsletter
- Vues d’article : Nombre total de clics pour ouvrir/lire un de tes articles
Démographie abonnés newsletter
Filtre tes abonnés selon :
- Fonction
- Localisation
- Séniorité
- Secteur
- Taille d'entreprise
Nouveaux abonnés
Affiche tes abonnés par ordre d’arrivée. Tu vois un extrait de leur profil, leur poste et leur niveau de connexion.
Analytics concurrents
Puis retrouve tes analytics concurrents LinkedIn. D’abord, ajoute les pages à comparer à la tienne.
Tu accèdes alors à deux nouvelles sections pour suivre ta croissance versus la leur.
Résumé concurrence
Vois combien de posts tu as publiés face à tes concurrents sur les 30 derniers jours, ainsi que ton engagement rate par rapport au leur.
Métriques nouveaux abonnés concurrents
Vois ton classement sur les nouveaux abonnés comparé à celui de la concurrence sur les 30 derniers jours.
Métriques contenu organique concurrents
Vois comment tu te situes sur les engagements total et le nombre de posts par rapport à la concurrence.
Analytics advocacy employés
Découvre ici les métriques advocacy employés à suivre et mesure l’activité de tes collaborateurs. LinkedIn étant pro, beaucoup d’employés y parlent de la marque pour laquelle ils travaillent.
C’est ce qu’on appelle employee advocacy : tes équipes défendent activement ta marque, ce qui élargit ta portée et génère plus de leads/ventes.
Si tu veux lancer une campagne employee advocacy, profite de cette section. Tu accèdes à des données comme :
- Combien d’employés publient
- Combien de membres LinkedIn interagissent avec tes employés
- Les contenus recommandés à ton équipe
Plusieurs indicateurs sont disponibles selon tes objectifs pour le programme advocacy.
Comment voir les analytics de tes publications sur LinkedIn ?
L’une des meilleures fonctionnalités de reporting de la plateforme est la possibilité de voir les analytics de chaque publication LinkedIn. Cette section se trouve dans l’onglet Content engagement, lui-même dans Content analytics de la plateforme LinkedIn.
Tu peux ainsi consulter les données d’engagement pour chaque post, présentées sous forme de graphique clair. Tu y vois :
- Titre de la publication
- Audience
- Boost disponible
- Auteur
- Date de création
- Impressions
- Vues
- Clics
- CTR
- Réactions
- Commentaires
- Reposts
- Abonnements
- Engagement rate
- Engagements
Mais tu retrouves toutes ces infos, et même plus, directement dans ton dashboard Socialinsider. Va dans la section Posts, puis clique sur Voir les analytics en bas de chaque post pour accéder à des rapports LinkedIn ultra détaillés.
Tu y obtiendras aussi :
- Hashtags
- Réactions
- Commentaires
- Partages
- Reach
- Impressions
- Clics sur les liens
- Engagement
- Engagement rate
- Taux d’engagement par impressions
- Distribution de l’engagement dans le temps
La section Posts de Socialinsider te permet aussi de trier tes publications selon différents critères : engagement, engagement rate, clics, etc.
Tu peux ainsi voir la liste de tes contenus les plus performants, et cliquer sur chacun pour plus de détails personnalisés.
Comment lire un rapport analytics LinkedIn ?
Tu dois analyser des analytics mais tu ne sais pas comment bien comprendre ton rapport ? Découvrons comment réaliser une analyse LinkedIn pour mieux interpréter ce que tes métriques révèlent.
Commence d’abord par le suivi de tes performances. Cela mettra en avant les métriques clés autour des performances de tes publications et de tes analytics LinkedIn globales.
Par exemple, regarde :
- Tes publications les plus performantes
- Le type de publications
- Le reach et l’engagement obtenus
- L’évolution de ton reach et de ton engagement depuis la dernière période de reporting
Poursuis avec les données démographiques de ton audience. Analyse des infos comme :
- Le nombre total d’abonnés
- La croissance de tes abonnés
- Les données démographiques de tes abonnés
Beaucoup pensent que le nombre d’abonnés n’est qu’une métrique de vanité, juste pour les apparences. Mais observer ta croissance reste important : cela montre combien de personnes s’intéressent vraiment à ton business ou à ton contenu au point de te suivre activement.
Ensuite, explore des pistes d’optimisation de contenu. Tu as déjà identifié des métriques essentielles lors du suivi de performances. Elles t’aideront à répondre à des questions comme :
- Ta content strategy fonctionne-t-elle en ce moment ?
- Un type de publication dépasse-t-il les autres ?
- Puedes-tu optimiser ta stratégie en partageant encore plus de contenus performants ?
Pense ensuite à ton budget publicitaire LinkedIn. Certaines publications mériteraient-elles un coup de boost pour gagner encore plus en reach et engagement ? Booster du contenu déjà performant permet de toucher une audience encore plus large.
Enfin, examine ta stratégie dans son ensemble. Cibles-tu la bonne audience ? Si ce n’est pas le cas, comment pivoter pour que ton contenu atteigne la bonne cible ?
Toutes ces informations te donneront une vue claire sur tes performances LinkedIn, te permettront de décrypter tes données et d’agir concrètement pour avancer.
Comment exporter les données analytics LinkedIn ?
Tu as deux moyens d’exporter ton rapport de performances LinkedIn. Soit directement depuis le dashboard LinkedIn, soit avec un outil de reporting tiers comme Socialinsider.
Pour exporter les données LinkedIn à la source, rends-toi dans ton dashboard analytics LinkedIn. Sélectionne le rapport à exporter—Content, Visitors, Followers, Competitors, Leads ou Employee Advocacy—puis clique sur l’onglet correspondant.
Clique ensuite sur le bouton Exporter en haut à droite du dashboard. Définis la période souhaitée (par exemple, la semaine, le mois ou le trimestre dernier) et lance l’export.
Tu pourras alors télécharger ton rapport au format XLS pour l’ouvrir et le modifier depuis Microsoft Excel.
Mais comme déjà mentionné, tu peux aussi exporter tes données LinkedIn à l’aide d’un outil analytics social media complet comme Socialinsider. Connecte-toi et accède au dashboard analytics de ton profil LinkedIn.
Tu peux exporter n’importe lequel des rapports proposés—Summary, Content, Engagement, Reach, Impressions, Audience, Posts, Compare ou Campaigns. Commence par choisir la période que tu souhaites partager. Clique ensuite sur le bouton Télécharger en haut à droite du dashboard du rapport.
Puis, sélectionne le format : XLS (Microsoft Excel), PDF (document) ou PPT (Microsoft PowerPoint).
Prépare ta page Summary avec tous les KPIs que tu souhaites suivre, puis exporte-la en PDF. C’est la méthode la plus simple pour compiler un rapport de performances LinkedIn. Tout est prêt d’un coup, il ne te reste plus qu’à exporter pour présenter le rapport sans perdre de temps.
Comment consulter les analytics pour un profil LinkedIn personnel ?
Tu veux voir les performances de ton profil personnel LinkedIn ? C’est aussi possible directement dans LinkedIn ! Sache que tu ne pourras pas utiliser un outil de reporting tiers pour consulter tes analytics LinkedIn personnels, mais tu peux obtenir un aperçu basique avec les outils LinkedIn.
Rends-toi sur ton profil LinkedIn, puis descends jusqu’à la section Analytics. D’un coup d’œil, tu verras le nombre de vues de profil, d’impressions de publications et d’apparitions dans les recherches sur la dernière semaine.
Clique sur Afficher toutes les analytics pour en voir plus.
Dans les analytics de ton profil LinkedIn, tu trouveras des insights comme :
- Impressions des publications : Combien de fois tes publications LinkedIn ont été vues au cours des sept derniers jours, avec l’évolution en pourcentage
- Followers : Le nombre total de followers, et l’évolution de ce nombre sur les sept derniers jours
- Vues de profil : Le nombre de personnes ayant consulté ton profil sur les 90 derniers jours
- Apparitions dans les recherches : Le nombre de fois où ton profil est apparu dans les résultats LinkedIn d’autres utilisateurs sur la semaine précédente
Tu peux aussi suivre les tâches recommandées pour rester actif et les outils de création disponibles.
Exploite au maximum tes données LinkedIn analytics
Commence un essai gratuit avec Socialinsider et découvre ce que les analytics LinkedIn ne te révèlent pas.