Análises do Twitter além do que a plataforma mostra para você
Um dashboard, visão competitiva completa. Socialinsider reúne dados de engajamento, crescimento e conteúdo de qualquer perfil público do Twitter e compara com o seu.


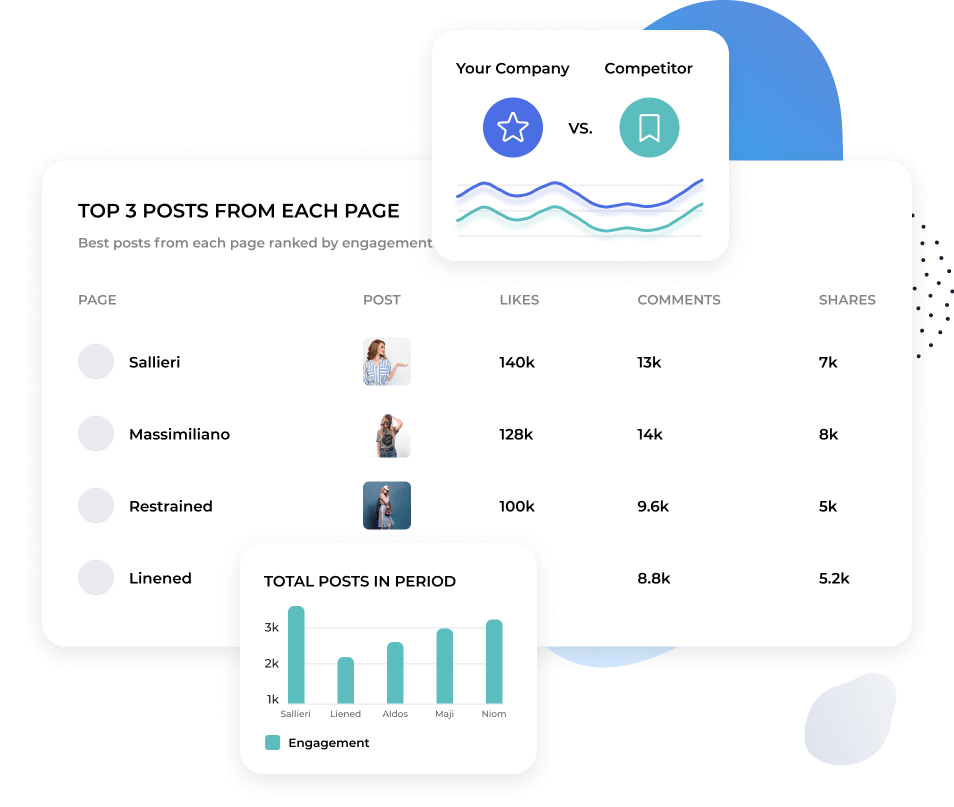
Compare seu perfil do Twitter com qualquer concorrente
Adicione qualquer perfil público do Twitter e veja engajamento, impressões, respostas, retweets e crescimento de seguidores lado a lado com o seu.
Não precisa alternar entre perfis nem tirar centenas de capturas de tela. Tudo em uma única visão para análise imediata e insights.
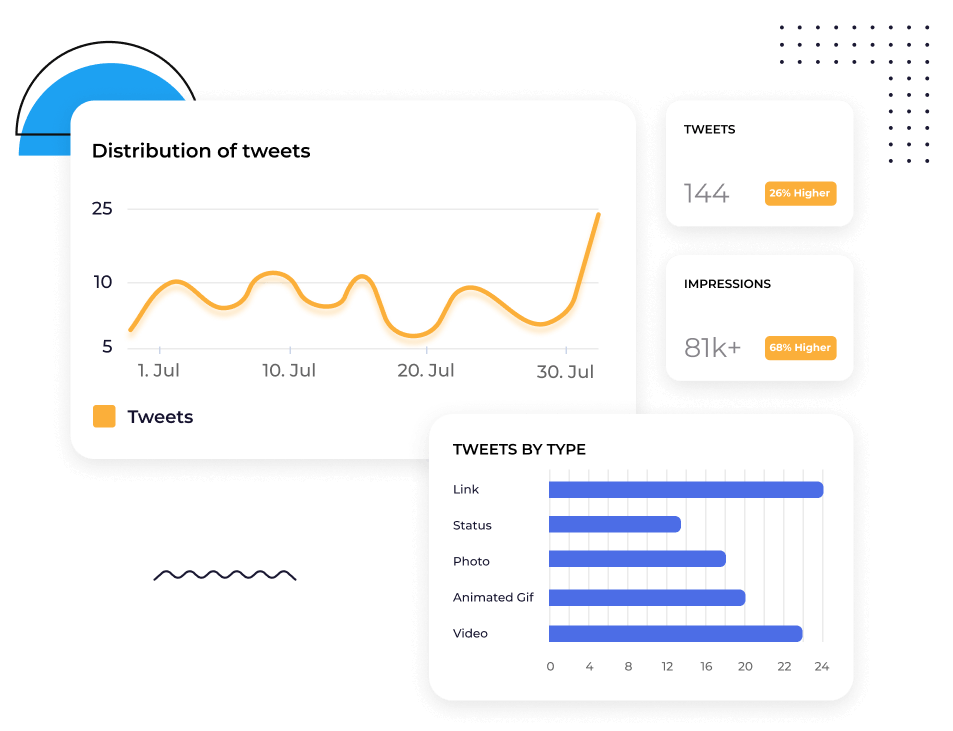
Descobre que conteúdo está dando resultado no Twitter
O Twitter muda rápido. O que faz sucesso hoje pode não funcionar amanhã.
O Socialinsider detalha a performance do conteúdo no nível das postagens e agrupa por tema. Assim, você descobre quais assuntos e formatos geram engajamento de forma consistente, não apenas quais posts viralizaram.

"Começamos a usar o Socialinsider para criar análises detalhadas de concorrentes."

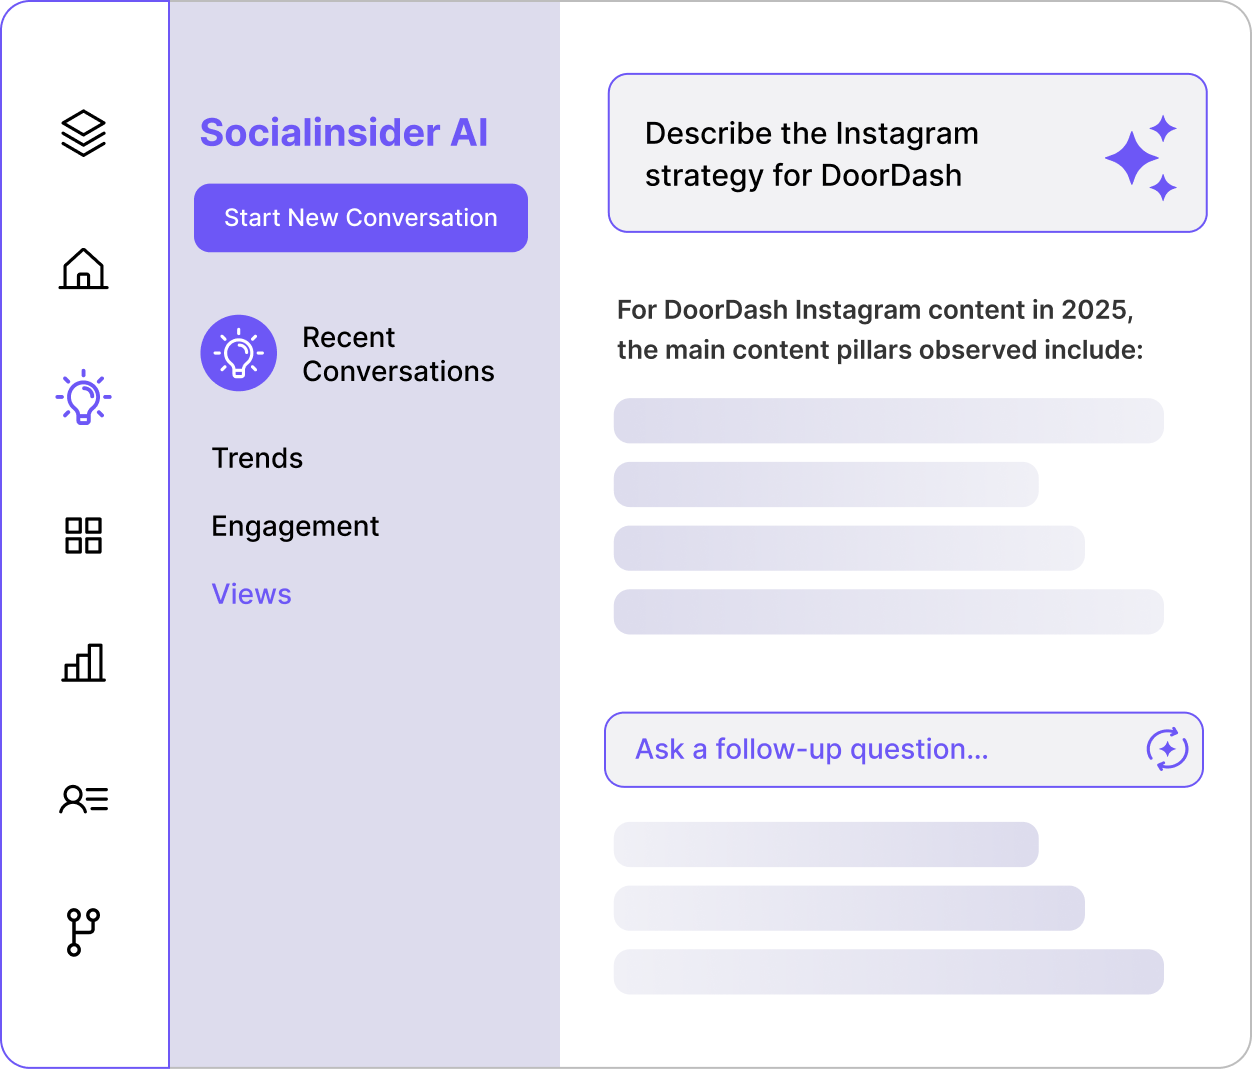
Pergunta à IA da Socialinsider o que está acontecendo no teu perfil do Twitter
Faz perguntas como: Por que as respostas aumentaram na semana passada? Ou como a nossa frequência de postagem se compara à do [concorrente]?
O Socialinsider AI usa seus dados do Twitter, os dados dos seus concorrentes e benchmarks do setor para te dar uma resposta escrita em que você pode agir.
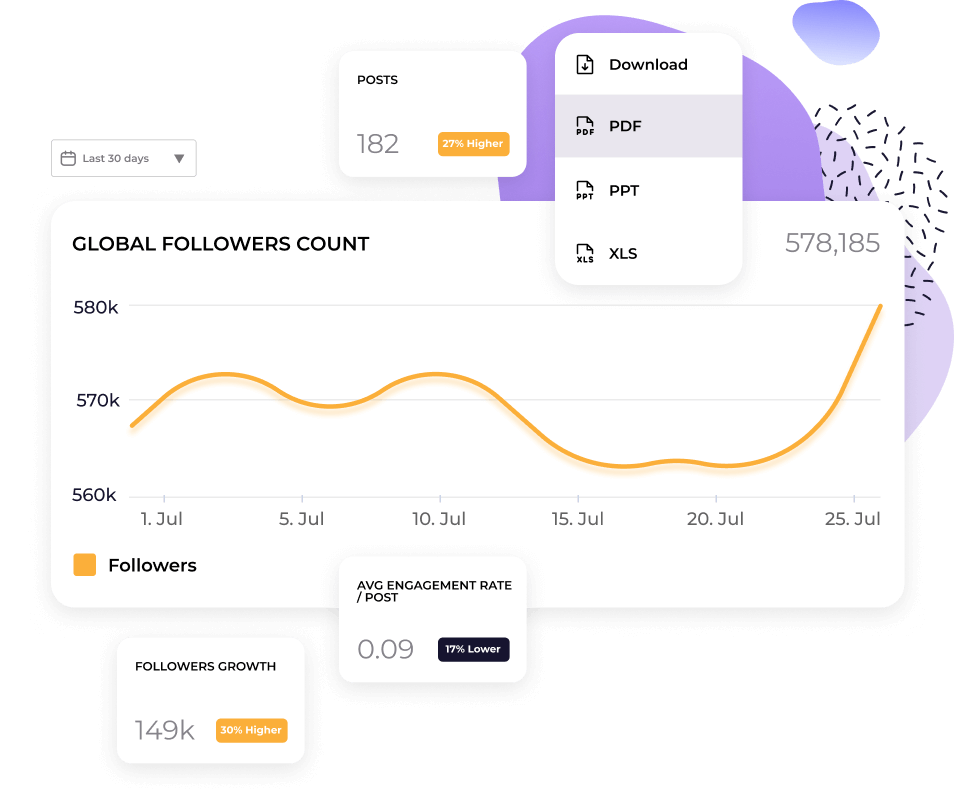
Automatize os relatórios do Twitter com relatórios prontos para apresentar
Exporte suas análises do Twitter em CSV, Excel, PDF ou PPT. Conecte ao Looker Studio se sua equipe gerencia dashboards lá.
Os relatórios já vêm formatados e com a tua marca. Assim, tu não perdes horas refazendo apresentações todo mês.
O que dizem sobre nós
"O atendimento ao cliente também foi um dos meus recursos favoritos. Vocês são simplesmente fenomenais. Sua equipe responde rápido, é muito amigável e prestativa. Isso não é comum."

"A Socialinsider te ajudou a entender se estás a melhorar ou piorar, especialmente em comparação com as outras contas que segues."

"A Socialinsider permite uma análise de concorrentes que traz insights sobre a tua performance em relação ao mercado."

"A análise de sentimento é incrível para hashtags do Instagram. Esse novo dashboard de social media listening me ajudou no planejamento de longo prazo."

"Estamos usando este dashboard de Social Media Analytics para todos os nossos 40 clientes de mídias sociais. Podemos acessar todos os dados de performance em um só lugar."

"Com o Socialinsider, tua equipe ficou mais eficiente. Não precisa perder tempo coletando dados de mídia social. Agora pode focar em insights e análises."

"Usamos o Socialinsider para obter insights de mídia social no dia a dia. Utilize para identificar mudanças estratégicas simples ou revisar a performance de posts específicos."

"Em média, um relatório de mídia social para uma marca leva de 1 a 2 horas de trabalho com Socialinsider. Antes, era preciso um dia inteiro para reunir os dados."

"Socialinsider já nos economizou mais de US$16 mil por ano. Permitiu poupar tempo em relatórios mensais e análises complexas de longo prazo."

Como acompanhar a taxa de engajamento do Twitter no Socialinsider
As ferramentas de social media analytics e análise de concorrentes do Socialinsider permitem que você meça a performance nas mídias sociais, faça auditorias e compare resultados.
Comece criando uma conta de teste no Socialinsider.
Adiciona teus concorrentes e conecta os perfis que tu gerencias.
Veja todas as métricas de engajamento de qualquer conta comercial do Twitter.
Compara tua performance com a dos teus principais concorrentes.
Faça uma análise multicanal para avaliar sua performance no Twitter.

Obtenha insights competitivos e explore
métricas de Social Media Analytics
Perguntas Frequentes
Tem uma pergunta? Temos as respostas.
O que é o Twitter analytics?
A análise do X (Twitter) envolve coletar e analisar dados da tua conta X para avaliar e otimizar tua estratégia e presença na plataforma.
Podes extrair várias métricas dos teus dados do Twitter, divididas em três grandes categorias:
- Público: crescimento de seguidores, dados demográficos e horários ativos.
- Conteúdo: impressões de Tweets, visualizações de vídeos, engajamentos, taxas de engajamento e cliques em links.
- Performance de campanhas: custo por engajamento, taxas de conversão e retorno sobre o investimento em anúncios (ROAS).
Podes acompanhar tua atividade no Twitter usando o analytics nativo do Twitter (mas atenção: só disponível com o plano premium pago do X) ou através de uma ferramenta terceirizada, como o Socialinsider.
Acompanhar e interpretar teus dados de analytics de forma eficiente é essencial para qualquer estratégia de marketing no Twitter. Os insights do Twitter te ajudam a:
- Fazer uma auditoria no Twitter: com uma visão completa de toda tua atividade, identificas rápido o que funciona e o que não funciona—sem desperdiçar tempo ou orçamento em táticas que não entregam resultado.
- Mensurar a performance do conteúdo: entende quais publicações recebem mais visualizações, impressões, curtidas, respostas ou retweets e ajusta teus posts para otimizar resultados.
- Analisar o crescimento do perfil: monitora visitas ao perfil e seguidores para ver se teu conteúdo realmente impulsiona o crescimento da página.
- Identificar tendências: no teu público, no setor e na plataforma como um todo—assim, tu acompanhas as conversas dinâmicas pelas quais o Twitter é conhecido.
- Exportar dados para relatórios e medir ROI: acompanha de perto como o investimento e os recursos estão gerando retorno. Exporta dados do Twitter analytics para criar relatórios claros e acionáveis para ti e para os stakeholders da empresa.
Por que acompanhar o X (Twitter) analytics é importante
Se você usa mídia social na sua estratégia de marketing, precisa se familiarizar muito com Social Media Analytics. Isso é ainda mais importante para o Twitter.
Primeiro, a própria natureza do Twitter é... bem, um pouco avassaladora. Com mais de 300 milhões de usuários, um grande volume de Tweets e conversas que acontecem em alta velocidade, é normal se perguntar se é possível realmente se destacar no meio de tanto conteúdo.
Segundo, o Twitter passou por mudanças enormes desde que foi adquirido por Elon Musk em 2022 — e não foi só mudar o nome para X:
- Funcionalidades e recursos - Musk compartilhou que imagina o X como um “aplicativo para tudo”. Por isso, novas funções e recursos são adicionados o tempo todo: de compras a contas X Premium e até o compartilhamento de receita de anúncios.
- Conteúdo mais diversificado - Antes conhecido pelos Tweets curtos de 140 caracteres, o X aumentou o limite para que usuários pagantes publiquem textos mais longos e também trouxe mais conteúdos multimídia.
- Crescimento da audiência - O X perdeu cerca de 32,7 milhões de usuários desde a aquisição. Mas analisando os dados demográficos, vemos um aumento no público da Geração Z (45% da Gen Z usa o X).
Como marcas podem usar Twitter Analytics
As marcas sempre usaram o Twitter para interagir de forma divertida e em tempo real com seu público (pense em marcas de fast-food como KFC ou Wendy’s). Porém, todas essas mudanças podem deixar você na dúvida se ainda vale a pena investir no X.
Por isso, Twitter Analytics são mais importantes do que nunca — vão te ajudar a responder essa pergunta. Você poderá:
- Coletar inteligência competitiva - monitore outros perfis e atividades no Twitter do seu setor para encontrar sua vantagem competitiva: outras marcas do seu nicho estão tendo sucesso? Quais são os principais assuntos? O segmento está saturado ou ainda há oportunidades? Tudo isso mostra se vale a pena manter uma presença no X.
- Oferecer uma experiência melhor ao cliente - toda boa estratégia de marketing começa entendendo seu público. A análise dos seguidores no Twitter revela quem você atrai (ou quer atrair), permitindo adaptar Tweets e campanhas às necessidades e preferências desses usuários. E não é só conteúdo — lembre-se de que o X é um canal fundamental para suporte ao cliente em tempo real.
- Entender tendências e padrões - o Twitter é altamente dinâmico e movido por tendências. Com debates sobre notícias e eventos acontecendo ao vivo, as análises ajudam a monitorar conversas emergentes, identificar padrões sazonais e entender o comportamento do público, para que você se mantenha relevante, adapte e aproveite momentos importantes para sua marca.
- Identificar o melhor conteúdo - Tweets continuam limitados a 280 caracteres para quem não paga, mas usuários pagos podem escrever até 4.000. Ainda assim, o Tweet médio tem entre 240 e 259 caracteres e recomenda-se postar de 5 a 10 vezes por dia. Com espaço limitado e alta frequência, você vai precisar de recursos, mensagens objetivas e uma voz marcante para ter sucesso. Acompanhar resultados no Twitter te ajuda a identificar os posts e formatos de melhor performance (ex: vídeo x texto), otimizar produção de conteúdo e impulsionar performance.
- Conseguir influenciadores e defensores no X (Twitter) - para aumentar visibilidade, engajamento e construir confiança, parcerias com influenciadores e defensores do X fazem toda a diferença. Com Twitter Analytics, você encontra seguidores que interagem com frequência com sua marca e identifica líderes e criadores populares no seu nicho. Não importa se vai criar sorteios, promover AMAs ou colaborar em tweets patrocinados — use as análises para medir o sucesso dessas parcerias.
Como visualizar Twitter Analytics
Agora que tu entendes por que é tão importante ter análises robustas do Twitter, talvez estejas te perguntando como visualizar tuas análises do Twitter.
Primeiro de tudo: as análises nativas do Twitter só estão disponíveis com uma assinatura paga do X Premium. Se tu tens uma assinatura gratuita ou apenas o plano básico do X, não vais conseguir acessar o dashboard de analytics do aplicativo.
A boa notícia é que tu podes usar uma ferramenta de terceiros, como o Socialinsider, para fazer análises avançadas sem pagar pelo X.
Aqui vai um guia rápido para acessar as análises do Twitter pelo X no celular, no desktop e também via Socialinsider.
Como ver analytics do X (Twitter) no celular
- Abre o app do X (Twitter) e faz login na tua conta.
- Clica na tua foto de perfil para navegar até tua página.
- Encontra o tweet que queres analisar.
- Clica no ícone "•••" (Mais) abaixo do tweet e escolhe "Visualizar analytics do Tweet" para ver dados detalhados de engajamento como impressões, curtidas e retweets.
A versão mobile dos analytics do X (Twitter) é bem útil para conferir rapidamente a performance dos Tweets. Mas para ter acesso completo às estatísticas da conta, tu vais precisar da versão desktop.
Como ver analytics do X (Twitter) no desktop
- Acessa X.com ou twitter.com e faz login.
- Clica em "Mais e Creator Studio" no menu lateral para encontrar o teu dashboard do X Analytics.
- Tu vais ver um resumo da performance da tua conta, incluindo:
- Resumo de 28 dias com impressões, visitas ao perfil, menções e seguidores
- Destaques como principais tweets, menções e seguidores
- Atividade de tweets e vídeos: métricas mais detalhadas como impressões, visualizações e engajamentos
- Rastreamento de conversões para campanhas de anúncios
Tu também podes explorar dados demográficos da audiência (idade, localização, horários ativos, etc.) e tendências de conteúdo ao longo do tempo.
Como ver analytics do X (Twitter) com o Socialinsider
Além do dashboard nativo, ferramentas como o Socialinsider entregam insights ainda mais poderosos para tu realmente turbinares tua estratégia no X.
Se quiseres entender dados de longo prazo, acompanhar KPIs importantes num dashboard de analytics do Twitter fácil de ler, acessar benchmarks e dados competitivos e automatizar teus relatórios—tudo sem pagar por uma assinatura do X—vale a pena experimentar.
Veja como visualizar analytics do Twitter com o Socialinsider:
- Cria ou faz login na tua conta Socialinsider.
- Cria um novo projeto ou entra em um já existente. Clica em "Conectar contas sociais".
- Conecta tua conta do X (Twitter) e depois seleciona a(s) página(s) que queres adicionar.
- No dashboard, escolhe a plataforma e a página que queres analisar.
- Aqui tu acessas uma grande variedade de analytics avançados—desde ferramentas de análise de concorrentes no Twitter do Socialinsider até dados históricos dos teus tweets.
Todas as métricas do X (Twitter) que tu precisas conhecer
O X não é só uma plataforma de mídia social única, como também passou por grandes mudanças. Por isso, não adianta copiar e colar tua estratégia de relatórios do Instagram ou TikTok—tu precisas entender bem quais métricas de analytics do Twitter acompanhar.
Antes de começar, define quais são teus objetivos. Os KPIs vão depender das tuas metas de negócio, mas normalmente o X funciona melhor para:
- Crescer tua audiência e aumentar o reconhecimento de marca
- Impulsionar o engajamento e fortalecer tua comunidade
- Gerar tráfego para o teu site
- Vendas diretas
- Posicionamento como referência
- Pesquisa de clientes e social listening
De modo geral, as métricas mais relevantes para acompanhar são as de visão geral, audiência e conteúdo. Vamos desmembrar cada uma e entender como se encaixam no todo.
Métricas de visão geral
O ritmo acelerado do X exige acompanhamento da performance em tempo real. As métricas de visão geral mostram todos teus KPIs num só lugar.
Nesse resumo do analytics da conta, tu consegues avaliar a eficácia geral da tua estratégia e identificar rapidamente padrões de performance.
Incluem:
Impressões (acompanha com Socialinsider) – o total de vezes que teu tweet foi visto, incluindo múltiplas visualizações do mesmo usuário. Monitorar impressões ajuda a medir alcance e visibilidade de marca no X.
Engajamento (acompanha com Socialinsider) – total de interações no tweet, como curtidas, respostas, retweets e cliques em links, hashtags ou mídia. Isso mostra se teu conteúdo está realmente conectando com a audiência. E muito engajamento aumenta tua visibilidade no algoritmo do X.
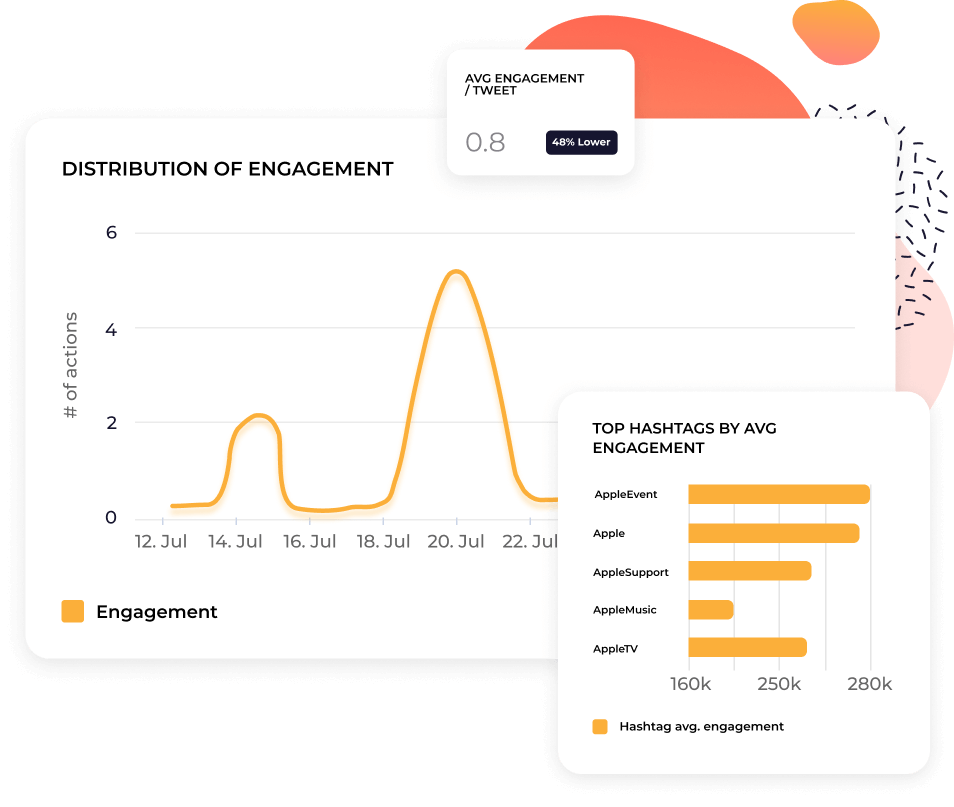
Taxa de engajamento (acompanha com Socialinsider) – percentual de usuários que interagiram com um Tweet, entre os que viram a publicação. Calcula somando todos engajamentos do tweet, dividindo por impressões ou total de seguidores e multiplicando por 100. Como variações no alcance podem fugir do teu controle (como uma atualização de algoritmo), a taxa ajuda a medir a qualidade, não só a quantidade do engajamento.
Visitas ao perfil (acompanha no app nativo) – quantas vezes clicam para ver teu perfil. É uma forma de entender se o conteúdo está gerando interesse e se as pessoas querem saber mais sobre tua marca.
Novos seguidores (acompanha com Socialinsider) – quantos seguidores novos tu ganhaste em determinado período. Isso mostra se tuas campanhas estão fazendo a audiência crescer. Ganhar seguidores indica que as pessoas querem continuar acompanhando o que tu publicas.
Respostas (acompanha com Socialinsider) – total de respostas diretas ao tweet. Indica que o conteúdo está gerando conversa—e é esse o principal objetivo do Twitter. É ótimo para aumentar o engajamento e fortalecer a comunidade, seja conectando pessoas ou recebendo feedback.
Curtidas (acompanha com Socialinsider) – a quantidade de curtidas em um Tweet. Curtidas são a forma mais rápida de interação e servem como selo de aprovação para o teu conteúdo.
Reposts (acompanha com Socialinsider) – quantas vezes teu tweet foi compartilhado ou "retweetado". Se alguém retweeta, é porque se identifica com teu conteúdo e acha valioso para a própria audiência. Criando conteúdo compartilhável, tu amplias teu alcance.
Favoritos (acompanha no app nativo) – quantas vezes teu tweet foi salvo. Esse dado é valioso: mesmo que a pessoa não interaja publicamente, o fato de salvar mostra que achou teu conteúdo útil ou interessante para rever depois.
Compartilhamentos (acompanha com Socialinsider) – total de vezes que teu conteúdo foi compartilhado, tanto dentro quanto fora do X. Inclui reposts e também envios via WhatsApp ou email. Assim, tu vês até onde tua mensagem está chegando além da tua base imediata.
Citações (acompanha com Socialinsider) – número de vezes que teu tweet foi republicado com comentários adicionais. Cada citação mostra que teu conteúdo provocou reflexão e engajamento mais profundo.
Crescimento de seguidores (acompanha com Socialinsider) – ritmo de aumento ou queda dos teus seguidores ao longo do tempo. Analisares teus seguidores é essencial para medir a saúde da tua presença no X e o impacto do teu conteúdo a longo prazo.
Métricas de audiência
No fim, a tua estratégia de X—desde o conteúdo criado até os KPIs—vai depender do teu público. Preferem vídeos ou links? Memes fazem sucesso ou confundem? Quando estão mais ativos? As métricas de audiência ajudam a responder tudo isso e mais.
Idade (acompanha no app nativo) – principais faixas etárias dos teus seguidores. Sabendo quem tu atinges, tu adaptas o conteúdo e a comunicação para dialogar com o público certo.
Gênero (acompanha no app nativo) – distribuição de gênero dos seguidores. Isso permite avaliar se a tua estratégia está conduzindo para um equilíbrio ou segmento específico, e otimizar campanhas conforme a meta.
Horários ativos (acompanha no app nativo) – momentos do dia ou da semana nos quais tua audiência está online no X. Como os Tweets têm vida curta, publica sempre quando teus seguidores estão conectados—esses dados ajudam a ajustar tua programação.
País (acompanha no app nativo) – principais localizações geográficas dos seguidores. Essa informação é chave para segmentação de anúncios, ajustar tom e referência cultural, e adequar campanhas para públicos globais ou locais.
Métricas de conteúdo
Para alguns, usar o X só para social listening ou suporte já é suficiente. Mas se tu quiseres impactar de verdade, vais precisar investir em conteúdo. E para isso, entender métricas de conteúdo é essencial.
Aqui estão os dados para tu criares uma estratégia vencedora no X:
Pilares de Conteúdo por IA (acompanha com Socialinsider) – com IA, o Socialinsider identifica os principais temas ou categorias do conteúdo, os chamados "pilares de conteúdo". Isso guia e organiza tua produção, ajudando a investir no que mais gera engajamento. Vê tanto o volume quanto a taxa de engajamento por categoria.
Engajamento por pilar de conteúdo (acompanha com Socialinsider) – mostra o desempenho de cada pilar monitorando curtidas, respostas, compartilhamentos, etc. Descobrir quais temas geram mais interações faz tu criares conteúdo com mais confiança.
Impressões por post (acompanha com Socialinsider) – total de vezes que um post aparece no feed. Comparar os posts individualmente mostra o que realmente expande o alcance da tua página.
Curtidas por post (acompanha com Socialinsider) – quantidade de curtidas em cada publicação. Indica de forma clara o que realmente agrada tua audiência.
Respostas por post (acompanha com Socialinsider) – número de comentários ou respostas a cada post. Mostra que tipo de conteúdo provoca conversas e engajamentos mais profundos.
Reposts por post (acompanha com Socialinsider) – quantas vezes um post foi repostado ou retweetado—qual é o potencial de compartilhamento de cada conteúdo. Monitorando isso, tu percebes o que faz as pessoas compartilharem teu material.
Taxa de engajamento por post (acompanha com Socialinsider) – quantos engajaram com aquele post, entre as pessoas alcançadas. Ajuda a destacar os posts de melhor desempenho, mesmo que o número absoluto de engajamento seja igual.
Tipos de postagens por engajamento (acompanha com Socialinsider) – mostra o engajamento por formato: links, texto, imagem, GIF animado ou vídeo. Garante que tu produzas mais do formato que mais performa.
Top posts por engajamento (acompanha com Socialinsider) – ranking dos posts de maior engajamento. Isso te ajuda a repetir e refinar táticas de sucesso e escalar ainda mais teu resultado.
Piores posts por engajamento (acompanha com Socialinsider) – publicações com menos engajamento. Identifica o que evitar para não desperdiçar tempo, orçamento ou esforço com o que não traz resultado.
Como criar relatórios de analytics do X (Twitter)
Creating detailed X (Twitter) analytics reports is helpful for you, the rest of your team, and company stakeholders. They’ll help you:
- Track performance to make sure your posts and activity are hitting KPIs
- Identify patterns and trends to refine your content creation efforts
- Gather helpful intel on your audience and competitors
- Communicate how your Twitter marketing is supporting wider business objectives
You can create Twitter reports in various formats by following the steps below.
a) CSV reports - create with SocialinsiderWith Socialinsider, you can export any data you see in your dashboard. Whether it’s a profile overview or top-performing posts, just look out for the “Download” button in the top-right corner.
When you click this, you’ll see a dropdown menu with different formats. Select CSV to export your data, which you can then import into Microsoft Excel or Google Sheets (note that only certain reports can be exported as CSVs).
b) PPT, PDF or Excel reports - create with SocialinsiderTo export your Socialinsider data into PPT, PDF or Excel reports, simply follow the same steps as above, but select a different format from the dropdown menu.
You can also automate reporting to get your favorite reports sent straight to your inbox. Just head to the “Autoreports” section in the left hand sidebar and start scheduling.
c) Looker studio - create with GoogleIf you’re working with a lot of data (for example, across multiple profiles, channels or brands), you might wish to use Google’s Looker studio (formerly Google Data Studio). Looker is a data visualization platform that can help you present and analyze your Twitter data in a bigger, more sophisticated marketing dashboard.
To pull in your Socialinsider data, log into Google Looker, go to “Data sources” and connect Socialinsider.
Como criar relatórios de concorrentes do X (Twitter) analytics
Teu perfil no Twitter pode trazer muitos dados, mas focar apenas nas tuas próprias métricas não vai garantir sucesso em Social Media. Para evoluir de verdade tua estratégia de marketing no Twitter, olha para fora: realiza análises regulares de concorrentes e benchmarking para descobrir o que rivais e líderes de mercado estão fazendo (ou deixando de fazer). Isso vai te ajudar a:
- Entender como tu te compares aos concorrentes
- Definir KPIs e objetivos realistas
- Acompanhar conversas e tendências do teu nicho
- Replicar estratégias de sucesso – ou aproveitar oportunidades que ninguém mais percebeu
Com Socialinsider, é fácil analisar os dados do Twitter de outros perfis usando as ferramentas de análise de concorrentes. Para cada perfil, tu podes acompanhar:
- Quais temas mais envolvem teu público? – Destaque os assuntos que geram mais engajamento para os concorrentes e usa-os como inspiração para os teus posts.
- Como as postagens performam ao longo do tempo? – Monitora e compara o desempenho dos posts do teu perfil e dos concorrentes. Assim, tu podes identificar padrões e entender melhor oscilações de performance, como atualizações de algoritmo que afetem o alcance geral.
- Crescimento de seguidores – Observa a contagem e o ritmo de crescimento dos seguidores dos concorrentes. Analisa os gatilhos para esses aumentos e usa esses insights para aprimorar tua própria estratégia de crescimento.
- AI content pillars – A análise com inteligência artificial do Socialinsider agrupa os posts dos concorrentes em pilares específicos, como posts educacionais ou notícias de entretenimento. Descobre o que impulsiona o engajamento dos concorrentes (ou de marcas que tu admiras), recria essas estratégias e ajusta teu mix de conteúdo.
Analisando todas essas métricas competitivas, tu consegues avaliar com precisão o que funciona ou não no teu nicho. Isso permite tomar decisões baseadas em dados e superar os teus rivais.
O que aconteceu com o analytics do X (Twitter)?
As análises do X (antes chamado Twitter) eram gratuitas para todos na plataforma. Com as mudanças recentes, a página nativa de análises do Twitter agora está disponível só para assinantes do plano Premium. Se quer saber como ver as análises do Twitter agora, tu tens duas opções:
a) Faz um upgrade para um plano pago no X (Premium ou Premium+)
b) Cria uma conta numa ferramenta de analytics de terceiros, como o Socialinsider
Onde estão as análises do X agora?
As análises do X agora estão protegidas por paywall, ou seja, tu precisas de uma assinatura Premium para acessar os dados de performance. Ou, se preferires, obtém relatórios avançados e insights usando uma ferramenta de terceiros como Socialinsider, sem precisar contratar um plano pago do X.
Por que não consigo ver as análises do meu Tweet?
Se você não consegue ver os analytics dos seus tweets, verifique qual tipo de plano do X você possui. Se for gratuito ou Básico, você não terá mais acesso ao analytics do X. Faça o upgrade para a assinatura Premium ou use uma ferramenta de terceiros como o Socialinsider.
Onde estão os analytics das postagens no Twitter agora?
Os analytics das postagens ainda estão disponíveis, mas só para usuários Premium. Se você não está mais vendo, é porque o X restringiu o acesso ao analytics sem um plano pago. Você também pode usar plataformas de analytics de terceiros, como o Socialinsider, para obter analytics avançados do Twitter sem precisar fazer upgrade.
Veja o panorama completo dos dados de Analytics do Twitter
Veja como o seu desempenho no Twitter se compara à concorrência. Tome decisões estratégicas apoiadas em dados.