How To Create An Effective Social Media Report Following 6 Essential Steps?
Learn the essential steps to craft a comprehensive social media report that effectively communicates your performance and guides future efforts.


Are you trying to prove your credibility to management? Or just hoping everyone on your team finally lands on the same page? I’ve been there: staring at a jumble of metrics, wondering how to turn them into a story people actually care about.
Instead of just random social media metrics inserted here and there, a good social media report helps guide decisions and prove social media ROI. And trust me, when you understand how to frame the data right, people start listening a whole lot faster.
In this guide, I’ll share how to build a social media report, backed by tips from Teddy Abdelnour, Head of Integrated Marketing at TEAM LEWIS.
Key takeways
-
What to include in a social media report? Include only the sections that support your goals and audience, focusing on the story the data tells rather than dumping every metric you have.
-
How to create a comprehensive social media report in just 6 steps? Define your goal and audience, choose your reporting frequency, collect and interpret the right data, visualize it clearly, and turn insights into actionable recommendations.
-
What are the key social media reporting metrics to include? Select metrics that map directly to business outcomes—like reach, engagement, audience insights, conversions, and benchmarking—so your report proves impact rather than showcasing vanity numbers.
What is a social media report?
A social media report is a structured summary of how your social channels performed over a specific period. It collects key metrics, highlights important trends, and explains what those numbers actually mean for your brand.
A good report shows how your content performs, how your audience behaves, and how your efforts support bigger business goals.
It answers questions like: Are we growing? Are we reaching the right people? Are we spending our time on the right content?
What to include in a social media report?
What you include depends on the story you want to tell. Select the elements that support your goals and highlight what matters most.
Teddy had a valuable insight into how to do that. He said:
Keep it simple by starting with the big picture, highlighting what moved the needle, then diving into platform breakdowns, content pillars, and audience behavior.
Always end with insights and next actions. At TEAM LEWIS, we treat it like a story, not a spreadsheet. We also include a quick ‘what we learned’ recap. It’s where we connect dots.
For example, for OPPO, we noticed UGC-style posts performed better when tied to photography features, not influencers.
Here’s a quick run-through on the sections you can pick from:
How to create a comprehensive social media report in just 6 steps
Creating a social media report does not have to be challenging.
Here’s a step-by-step guide on how to create an effective social media report.
Step 1: Define the goal and audience
Before I pull a single metric for my report, I decide why I am creating the report and who will read it. This choice shapes everything that comes next.
The goal and audience determine which metrics you include, what story you tell, and how much detail you go into.
Here’s how the audience changes the content:
- Executives/top management: They care about impact. Include revenue contribution, pipeline influenced, cost efficiency, brand visibility trends, and clear insights tied to business goals.
- Marketing managers: They want the ‘how and why.’ Include engagement metrics, content performance, audience shifts, platform breakdowns, and campaign efficiencies. They need enough detail to optimize future work.
- Social media specialists: They need the granular view. Include post-level stats, creative insights, publishing patterns, content pillars, and tactical recommendations.
Here’s how Teddy does it for his clients —
Different audiences look for different wins. For example, I have seen that OPPO and Nokia’s regional leads often care about business outcomes through social media. In comparison, social teams want creative insights. I keep the data consistent and shift the lens depending on who’s reading.
Step 2: Determine reporting frequency
Once you know the goal and audience, decide how often you need to report.
You can choose from weekly, monthly, quarterly, annual, or campaign-specific reports. The right cadence depends on three factors:
- Who the report is for:
Different stakeholders prefer different rhythms. For example, clients often expect monthly updates so they can track progress regularly. Whereas top management usually prefers quarterly reports that show broader trends and business impact.
Pick a cadence that matches their expectations.
- How active your social media efforts are:
If you run frequent campaigns or if social media is a major source of awareness and conversions, choose a weekly or monthly report. This helps you catch patterns quickly and adjust fast.
- What your goals are:
Match the cadence to the purpose.
- Trending topics or real-time content: weekly
- Account growth and platform-level performance: monthly or quarterly
- Strategic planning and year-over-year comparisons: annual
When asked about his reporting frequency, Teddy said:
I use weekly reports for pulse checks, monthly ones for detailed insights, and quarterly reviews for strategy. For big campaigns like OPPO launches, we work with faster cycles, but retainers work best with steady, structured reviews.
Step 3: Collect relevant data
Collect all data about your audience, content, and performance from all the platforms you’re active on. I generally do this using four sources:
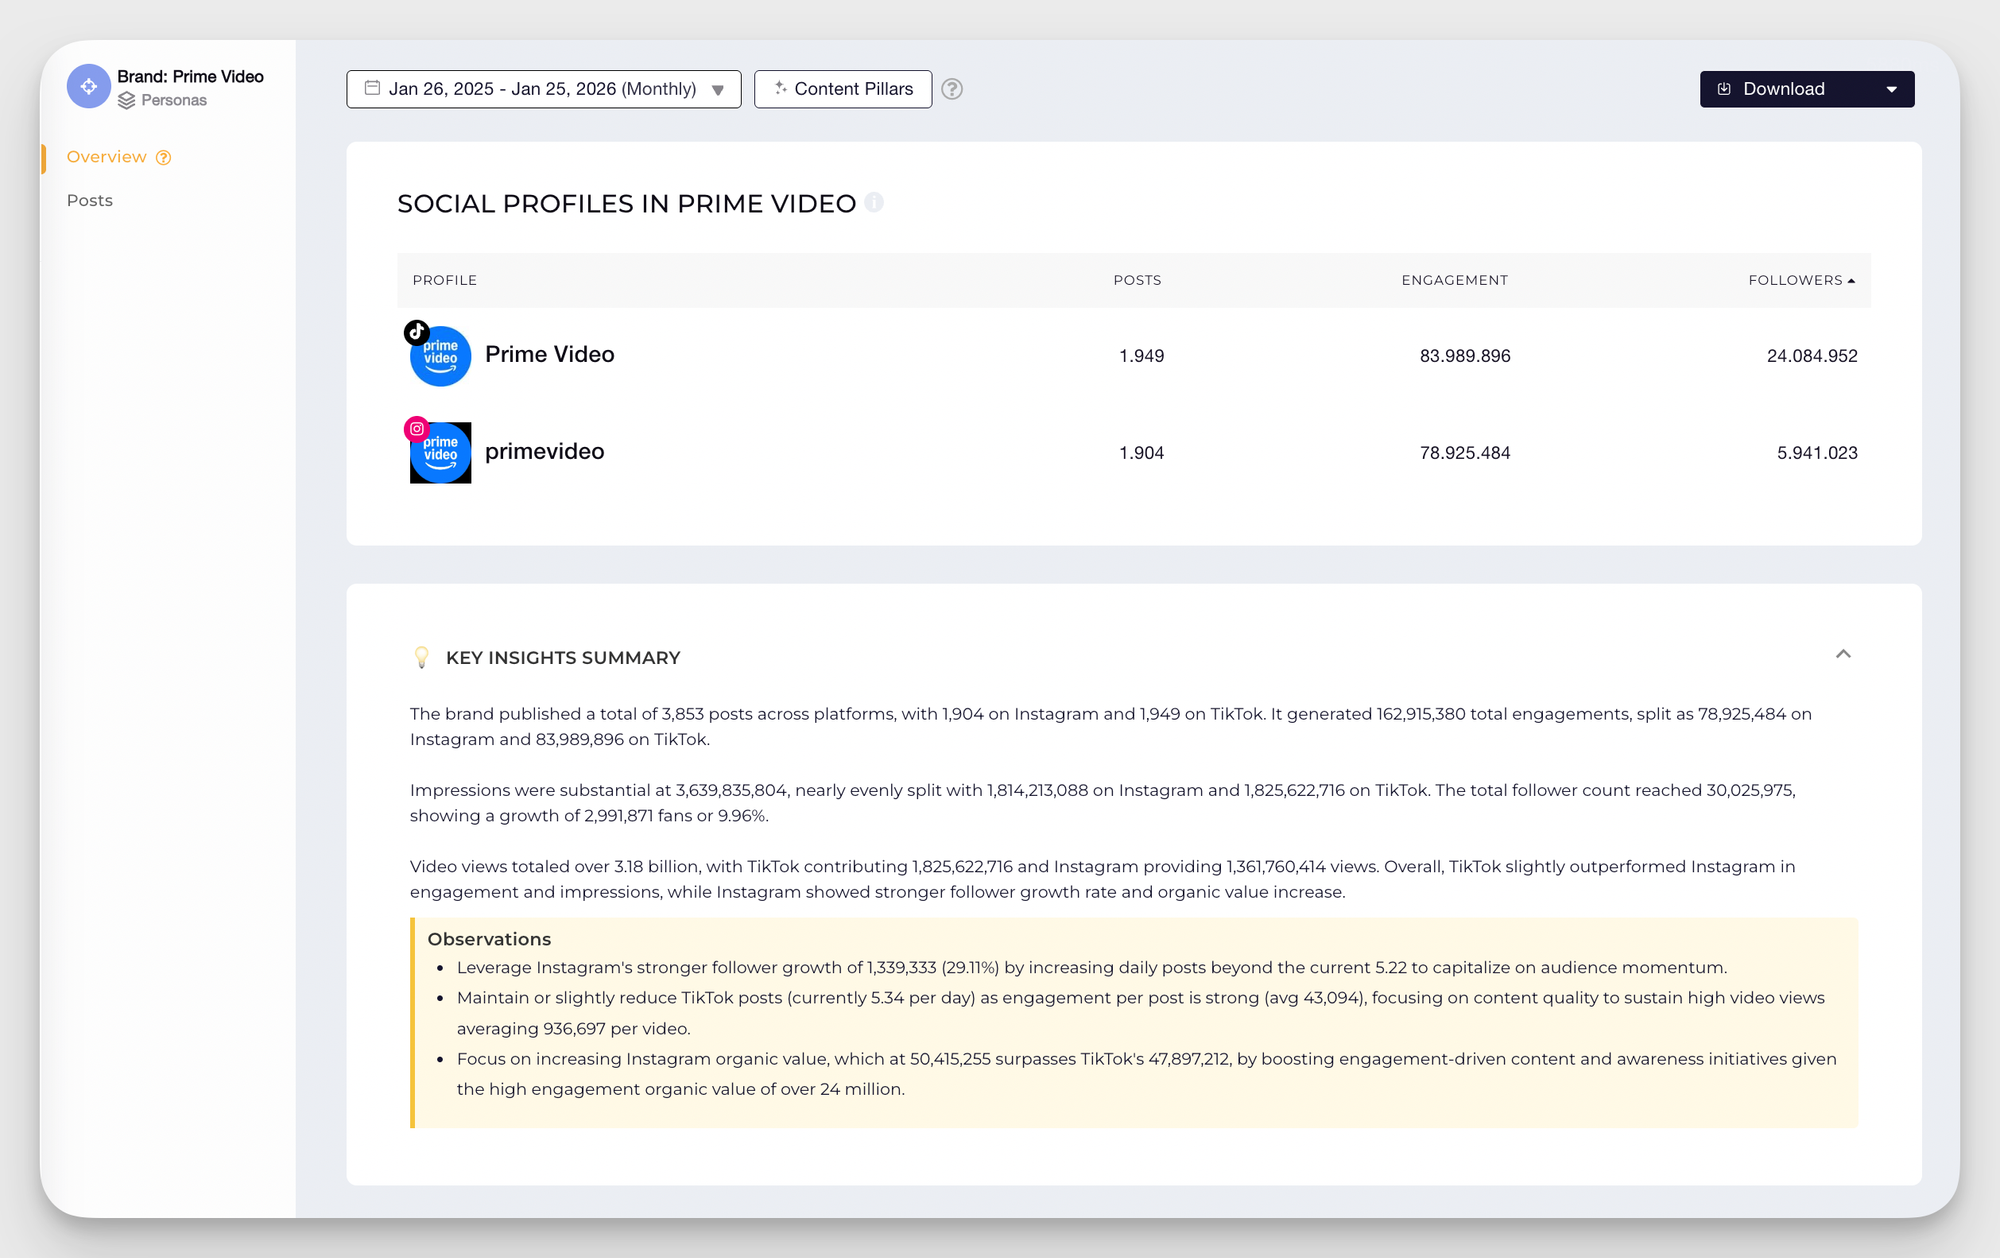
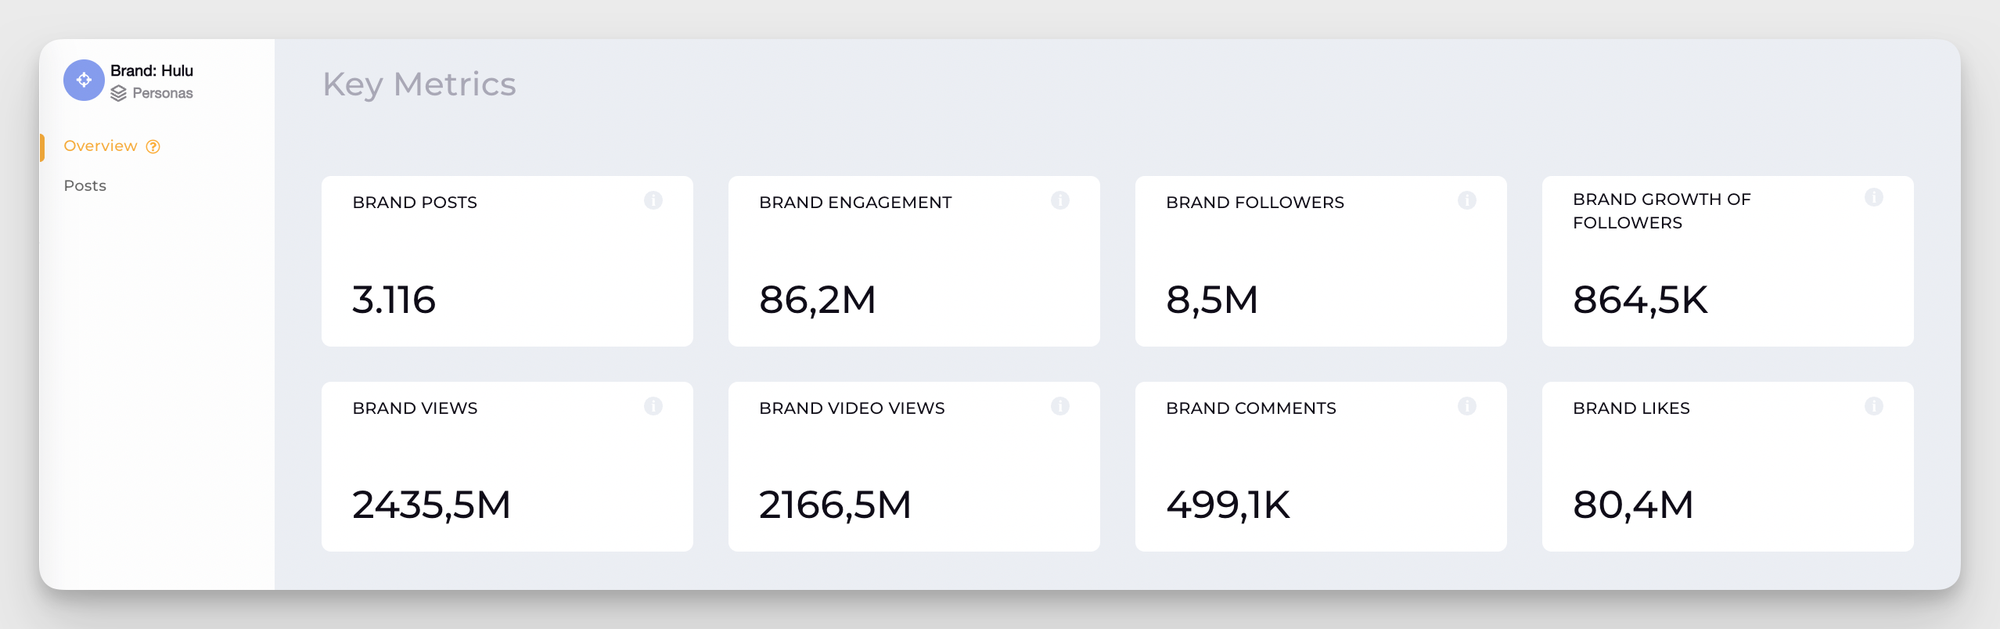
- Socialinsider: I use Socialinsider to pull data from all my key social channels in one place. This makes it easy to run a true cross-channel analysis—comparing performance side-by-side across platforms like TikTok, Instagram, Facebook, or even LinkedIn and YouTube, quickly showing you where your content is working best, which channels drive engagement, and where there’s room to improve.
But what really sets Socialinsider apart is its competitive benchmarking capabilities. Looking at your brand’s raw numbers is helpful, but without any outside context—how your competitors perform, or what’s normal for your industry—the story is incomplete.
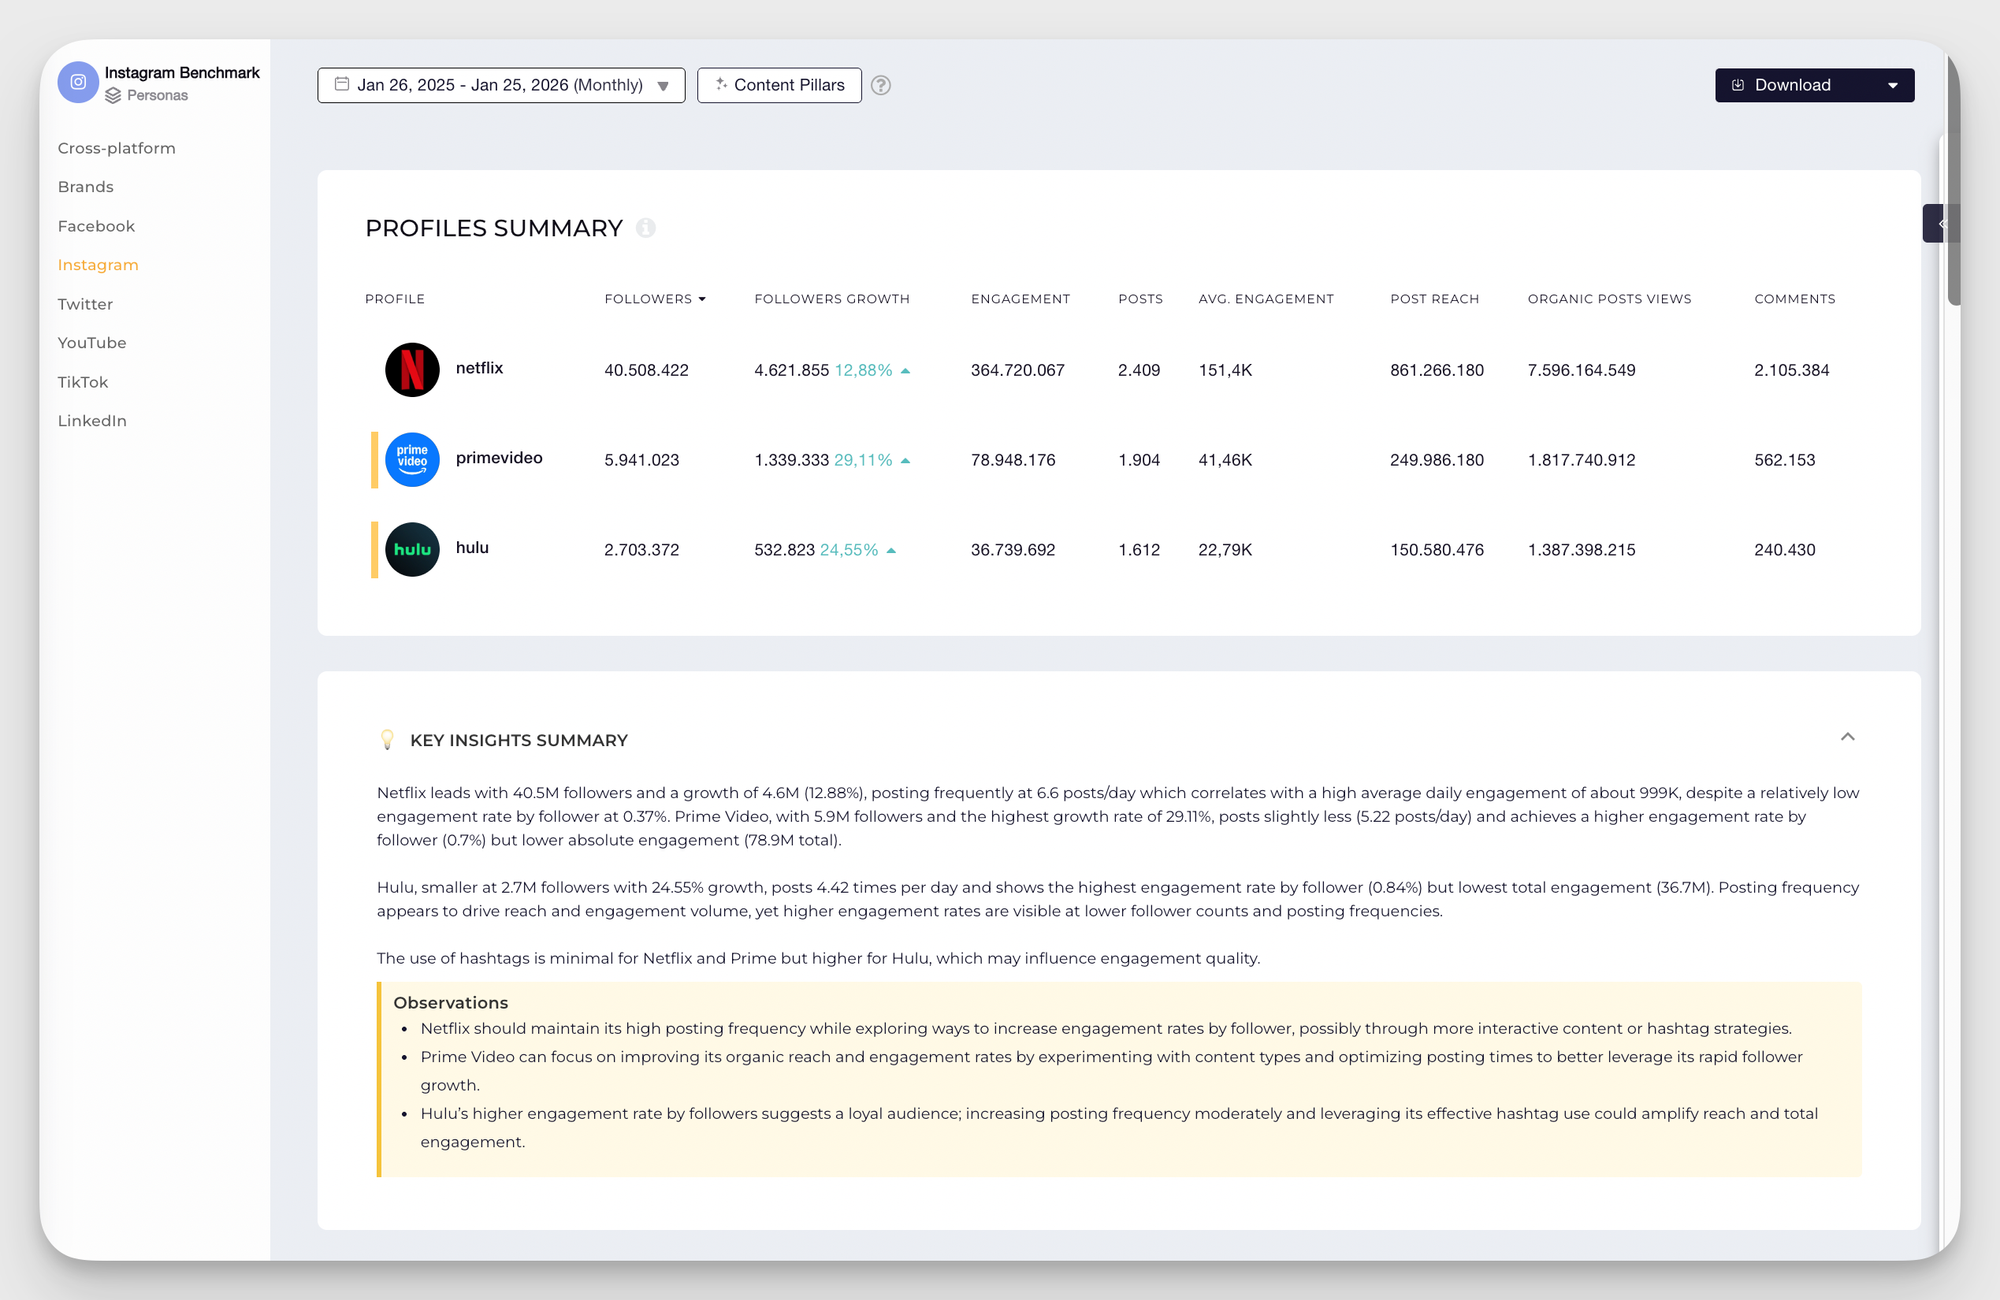
Socialinsider fills this gap by giving you access to aggregated competitor data and industry benchmarks, so you can see exactly where you stand.
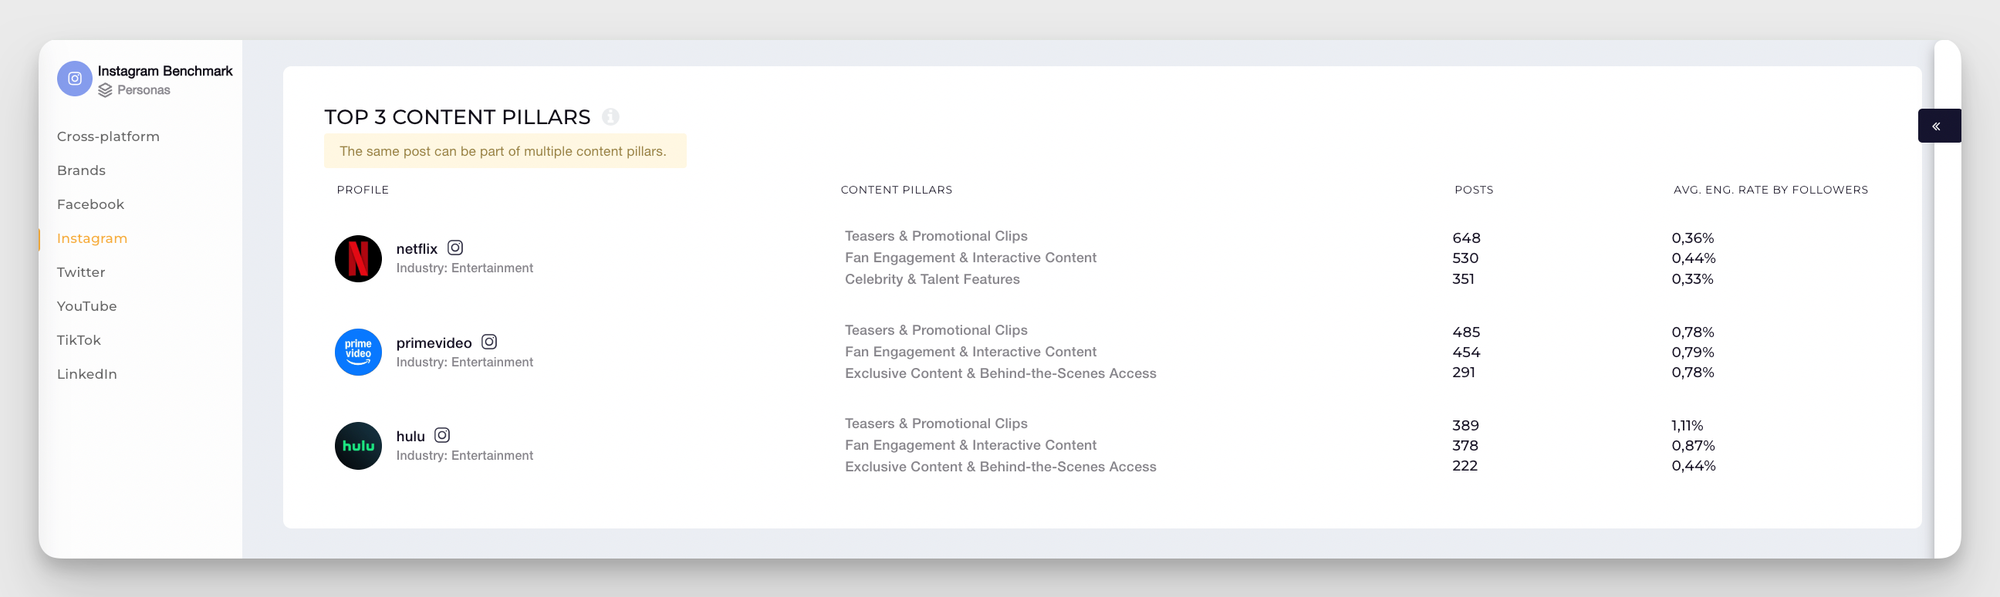
It also highlights best-performing posts and content formats, alongside top content pillars across all channels, helping you spot trends and uncover what works not just for you, but across your entire competitive landscape.
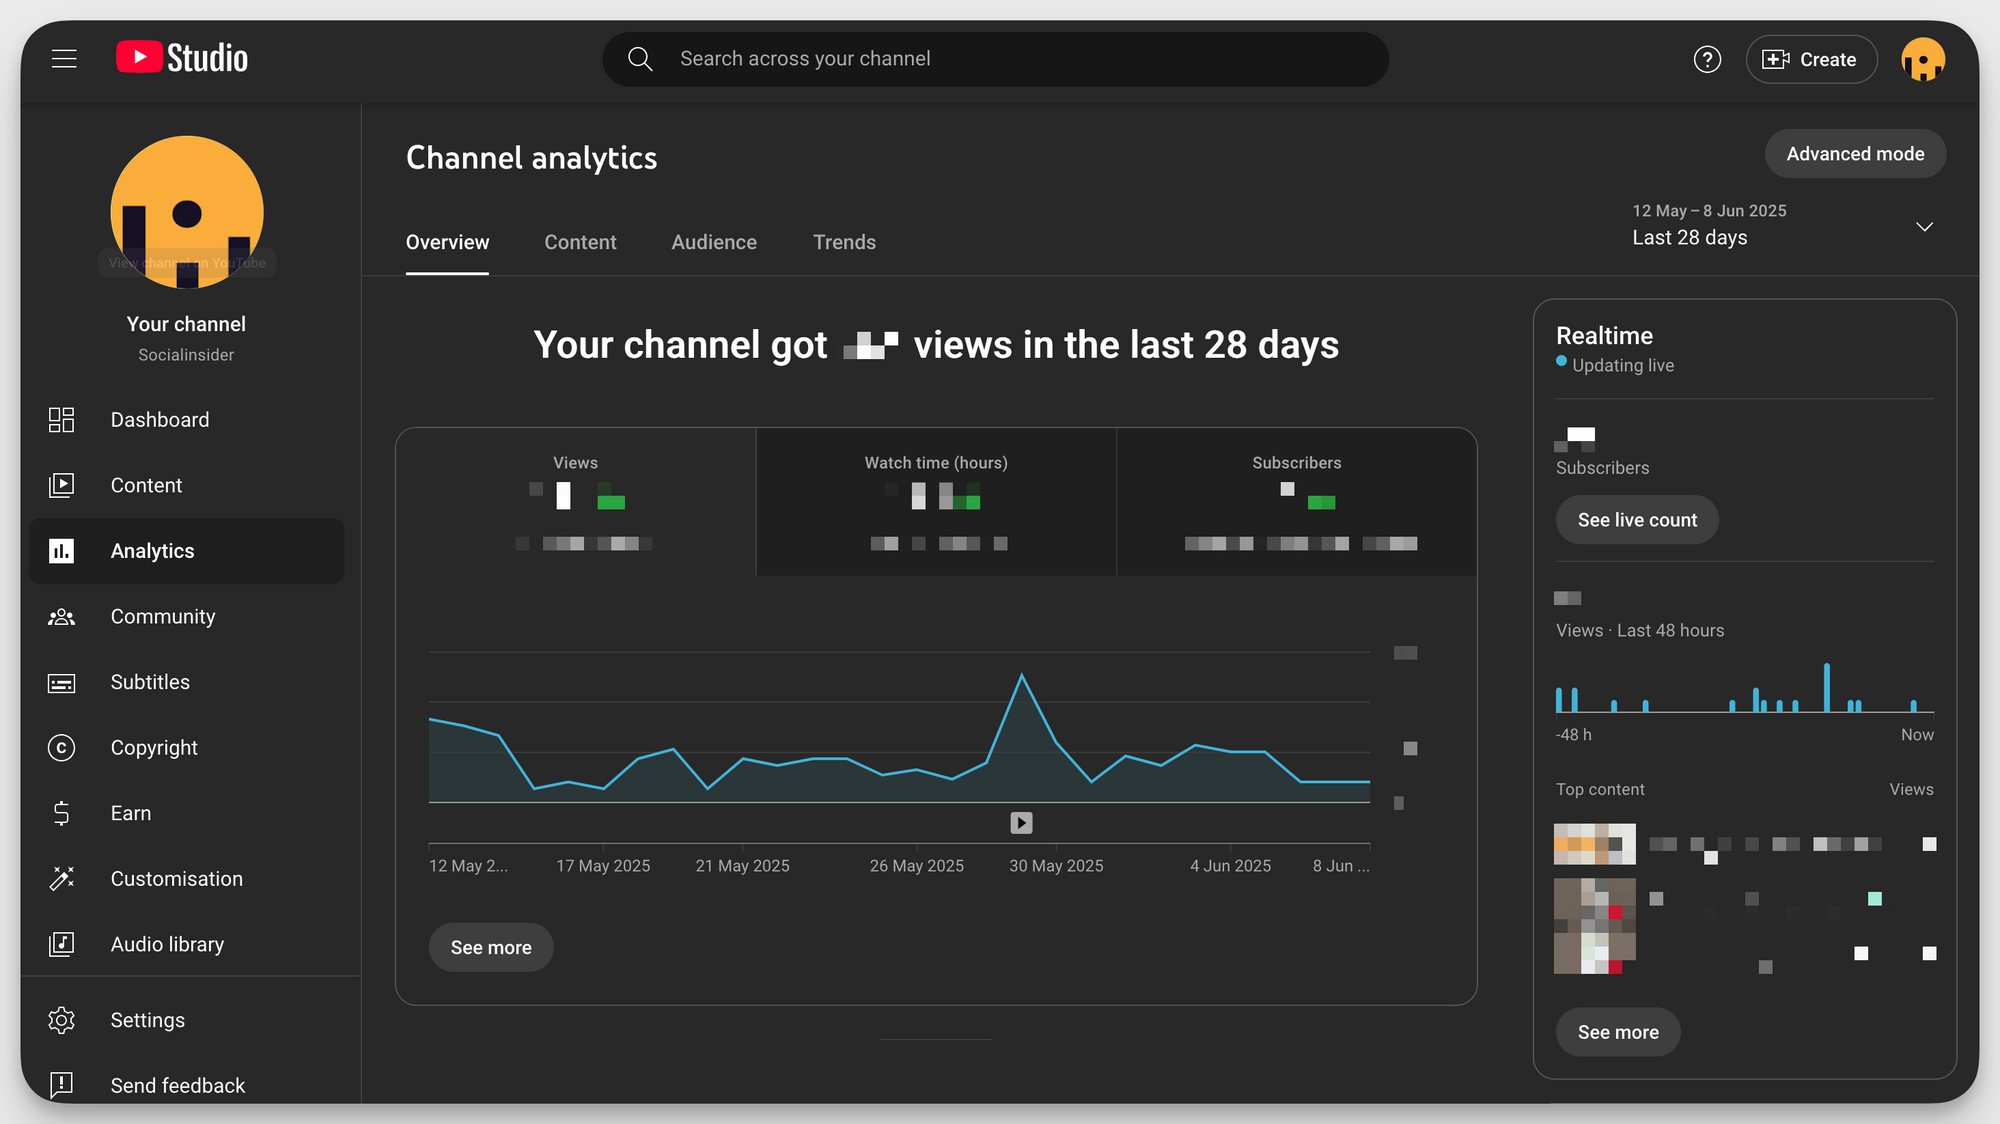
- Native platform analytics: Use native analytics features for platforms like TikTok and YouTube dashboards for detailed, channel-specific metrics.
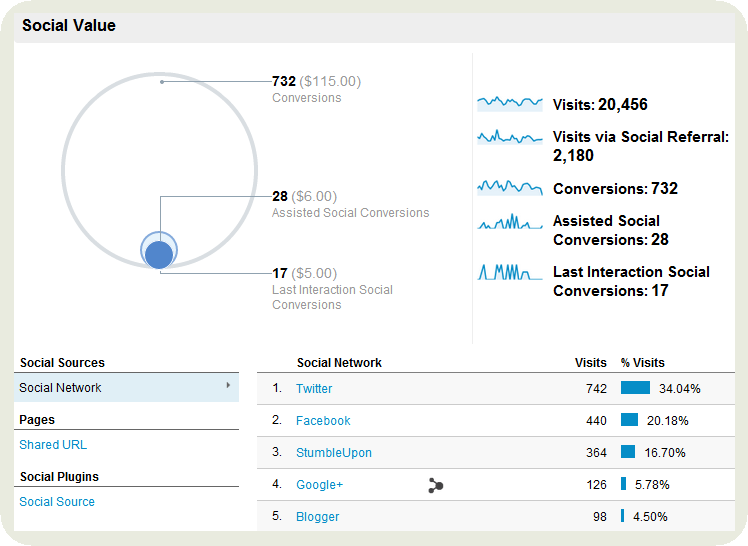
- Google Analytics: Shows how social traffic behaves on your website. Helps you connect content to sessions, conversions, and revenue paths.
- CRM tools: Links social leads to pipeline stages, revenue, and sales outcomes. This is essential when reporting to leadership or proving ROI.
Step 4: Analyze and interpret the data
Data without a clear interpretation won’t make much sense to your clients or management.
For example, one Socialinsider customer wanted to prove himself in his new role, and he used social media reporting to do that — “We didn’t just show numbers. We showed what drove those numbers.”
Break your social media analysis into simple buckets:
- By channel: Identify which platform pulled its weight. Maybe LinkedIn engagement jumped while X dipped. That instantly tells you where attention shifted.
- By content type: Check what formats worked. For example, videos might have doubled your reach while carousels brought stronger saves.
- By campaign: See which campaign contributed most to your KPIs. A launch might have driven clicks, while a brand series delivered deeper engagement.
- By time: Spot trends across weeks or months. Look for patterns like mid-week engagement peaks or seasonal drops.
- By competitor: Compare your results with industry players. Maybe you’re leading on engagement but lagging on follower growth. That shows where to improve.
Step 5: Visually present your findings along with recommendations
Your report should feel easy to read. One customer said it best: “Clean visuals build credibility. Executives shouldn’t have to interpret dashboards.”
Clear charts help people understand your story without guessing what the numbers mean.
Instead of pulling the data and creating the visuals, I use Socialinsider to get data in charts and graphs.
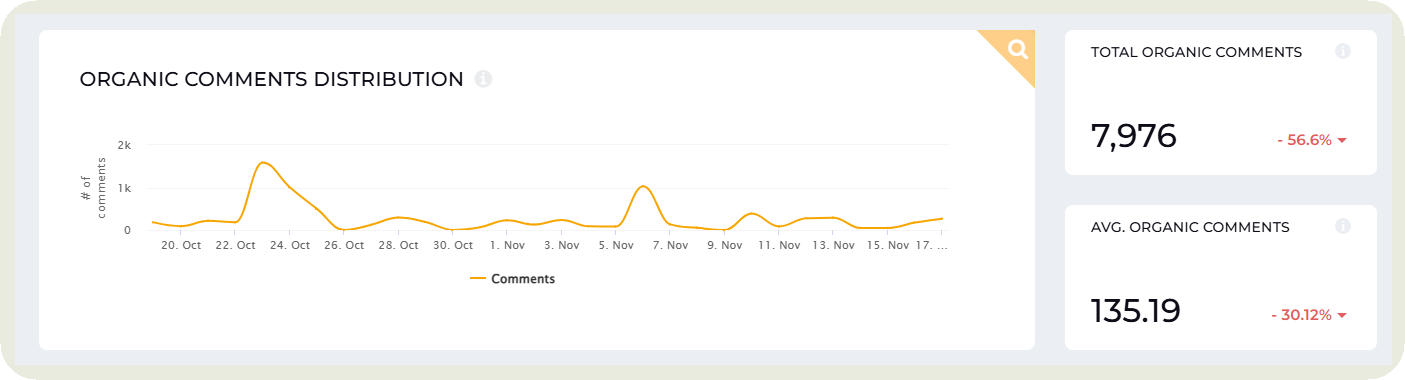
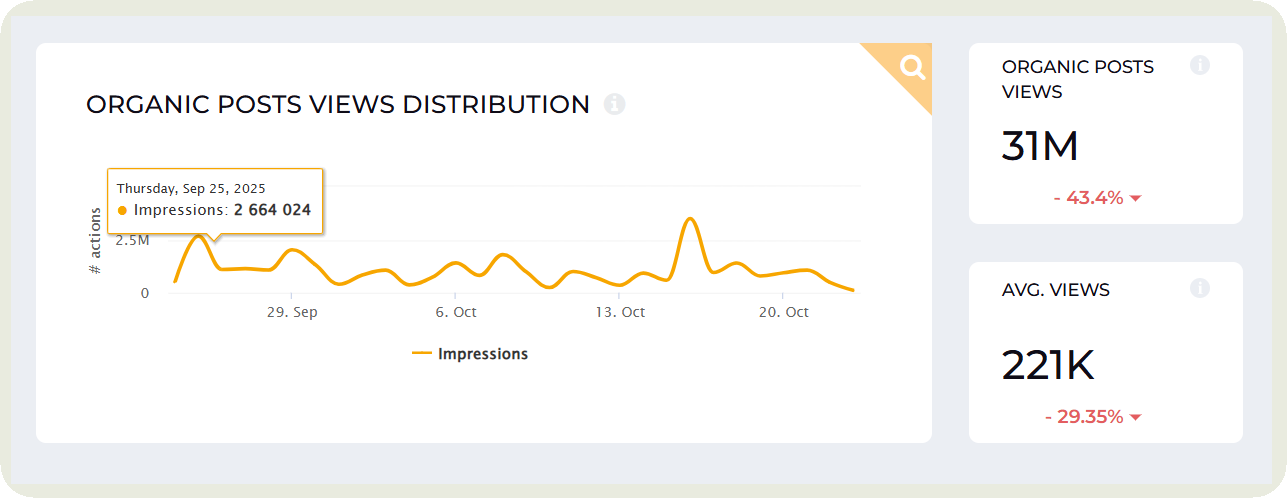
I focus on showing trends, not just totals in my report. For example, a line graph that highlights a steady rise in TikTok comments tells a much clearer story than a table of weekly counts.
When you analyze the data, make sure you pair every metric with an action. If Instagram reach dropped, suggest testing new hooks. If video retention increased, plan more short-form explainers.
A visual report with clear next steps makes your recommendations impossible to ignore.
Step 6: Build customizable dashboards with Socialinsider
Use a social media analytics tool like Socialinsider to create fully customizable dashboards for your social media report.
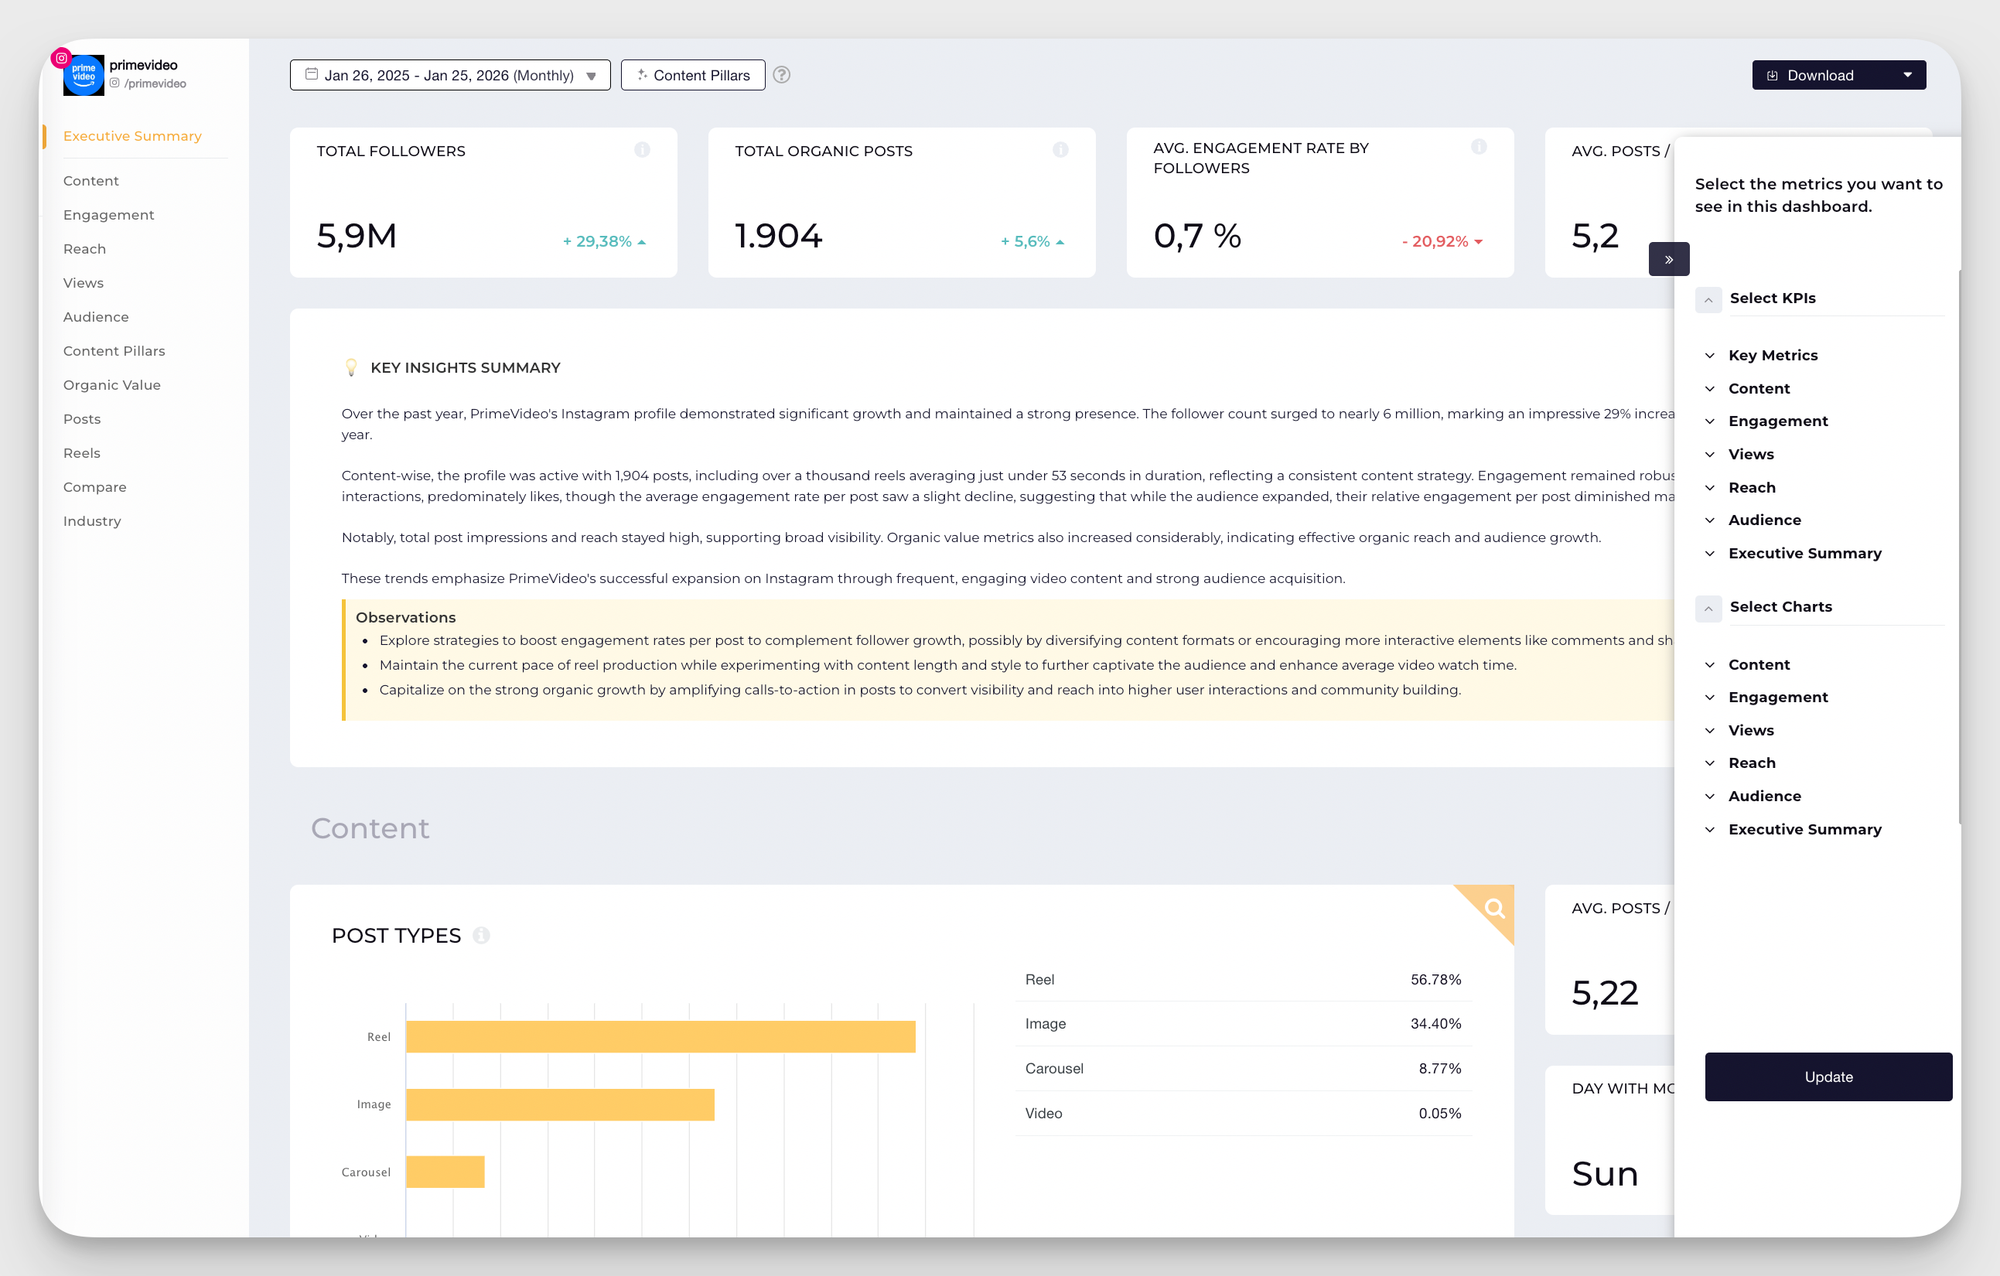
You can choose which platforms to include in your social media dashboard, filter by date range, content type, or campaign, and set up widgets to spotlight the social media KPIs that matter most. My favorite part is that these dashboards update in real-time, making it easy to track performance trends and share insights across your team.
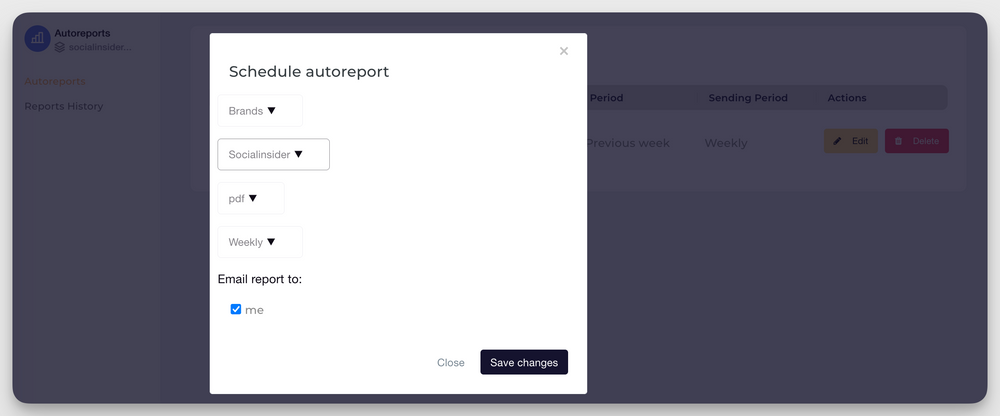
To present data to stakeholders, you can download reports directly from the dashboard in PDF, XLS, or CSV formats or share them via public links.
Key social media reporting metrics to include
The metrics you include in your report will be dependent on your goals and stakeholders.
While talking about metrics, Teddy said:
I choose metrics depending on the brand goal. For Nokia Cybersecurity, it’s trust and lead quality; for OPPO, it’s reach and shareability. I pick metrics that map directly to business outcomes, not vanity numbers.
To get you started, I have grouped metrics into six categories for easy selection.
Reach and awareness metrics
Reach and awareness metrics matter when your goal is visibility, brand recall, or top-funnel growth.
Include them if you’re trying to show how well your content is increasing brand exposure, entering new markets, or capturing attention on high-volume platforms.
- Reach: It shows how many unique people saw your content and how far your message actually traveled.
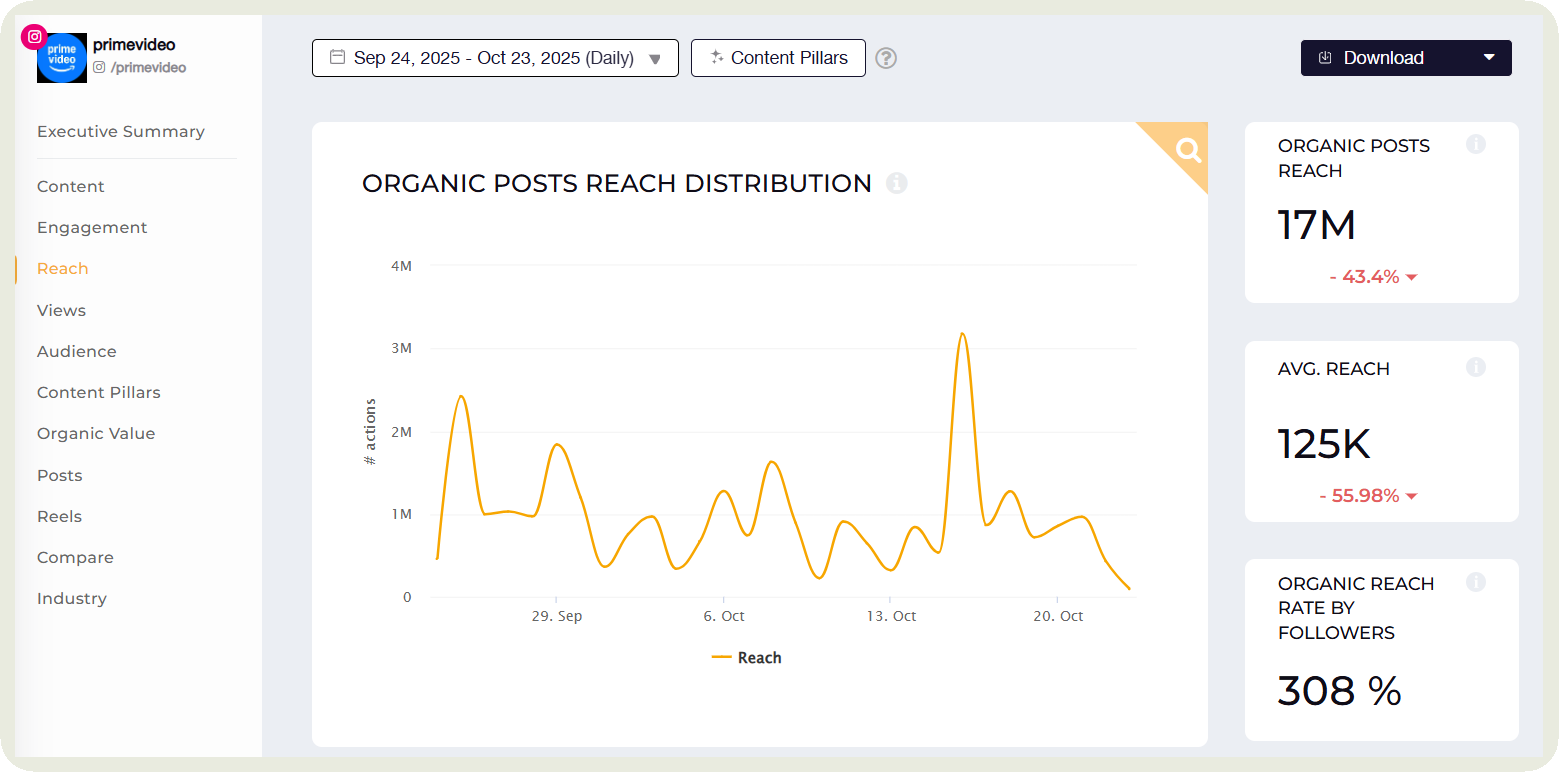
I use Socialinsider to evaluate reach by tracking growth over time and comparing it across platforms or campaigns to see where my visibility is increasing and what’s driving that lift.
- Views: Views show how often your content was watched, giving you a clear signal of attention and content consumption.
It’s basically used to measure how your videos are performing and what hooks capture attention.
- Brand mentions: Brand mentions show how often people are talking about your brand online.
I usually include this metric when I have run a large number of campaigns within that time period or if my goal is to measure brand buzz or sentiment shifts.
Audience analysis metrics
Audience analysis metrics show who you’re reaching and how different segments behave, covering demographics, interests, and engagement patterns.
Include them when your goal is to understand whether you’re attracting the right audience, entering new segments, or tailoring content to improve relevance.
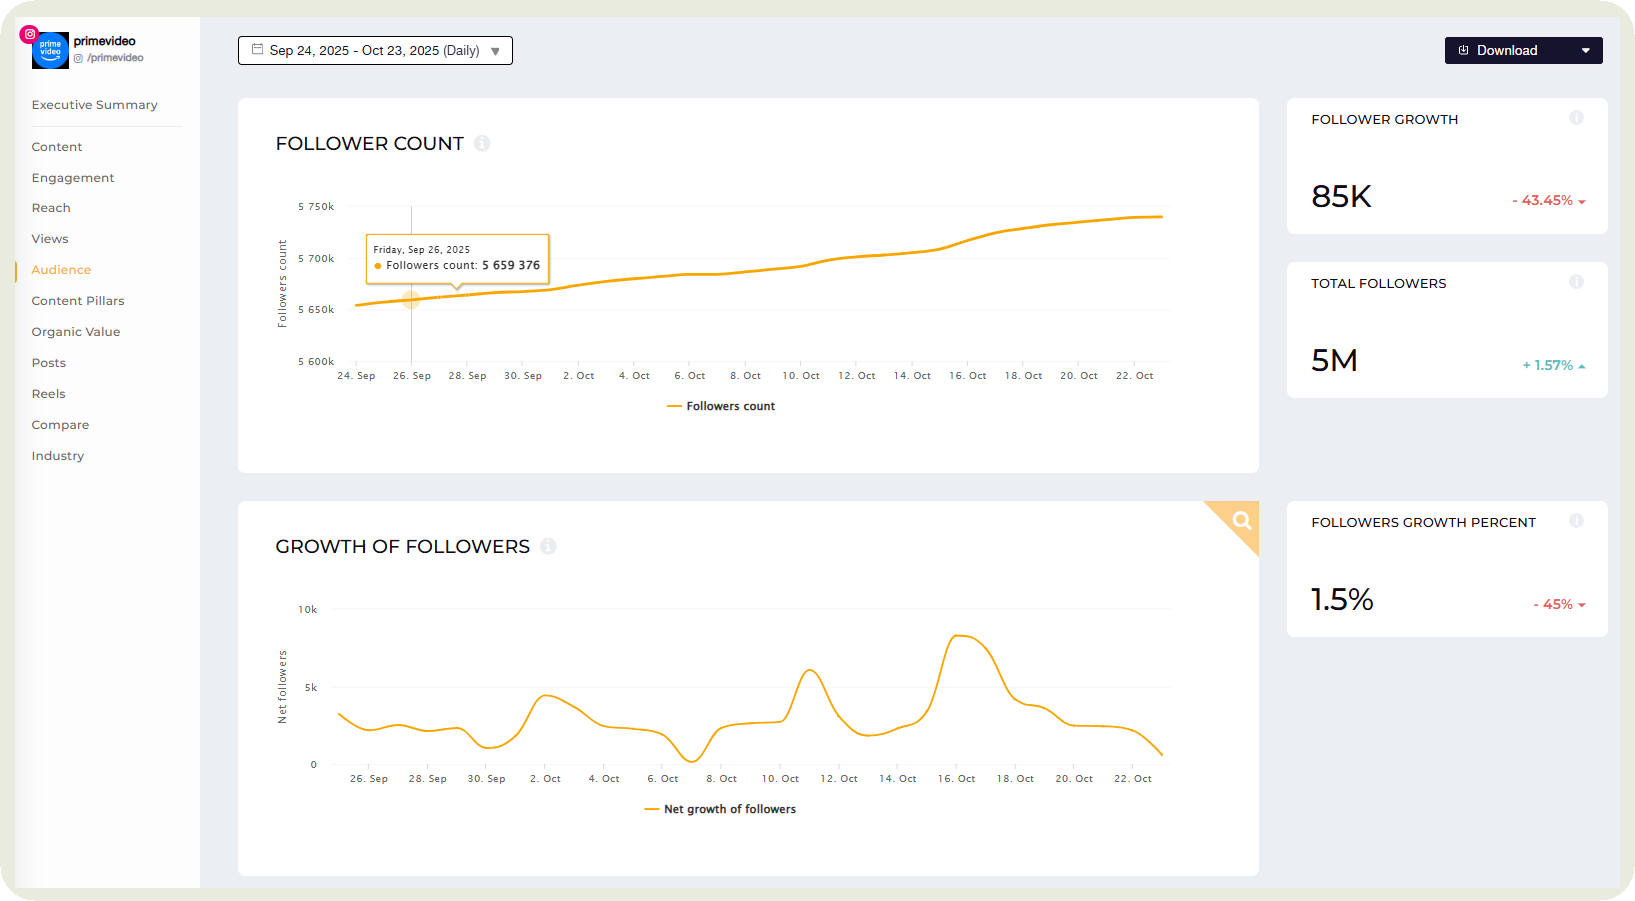
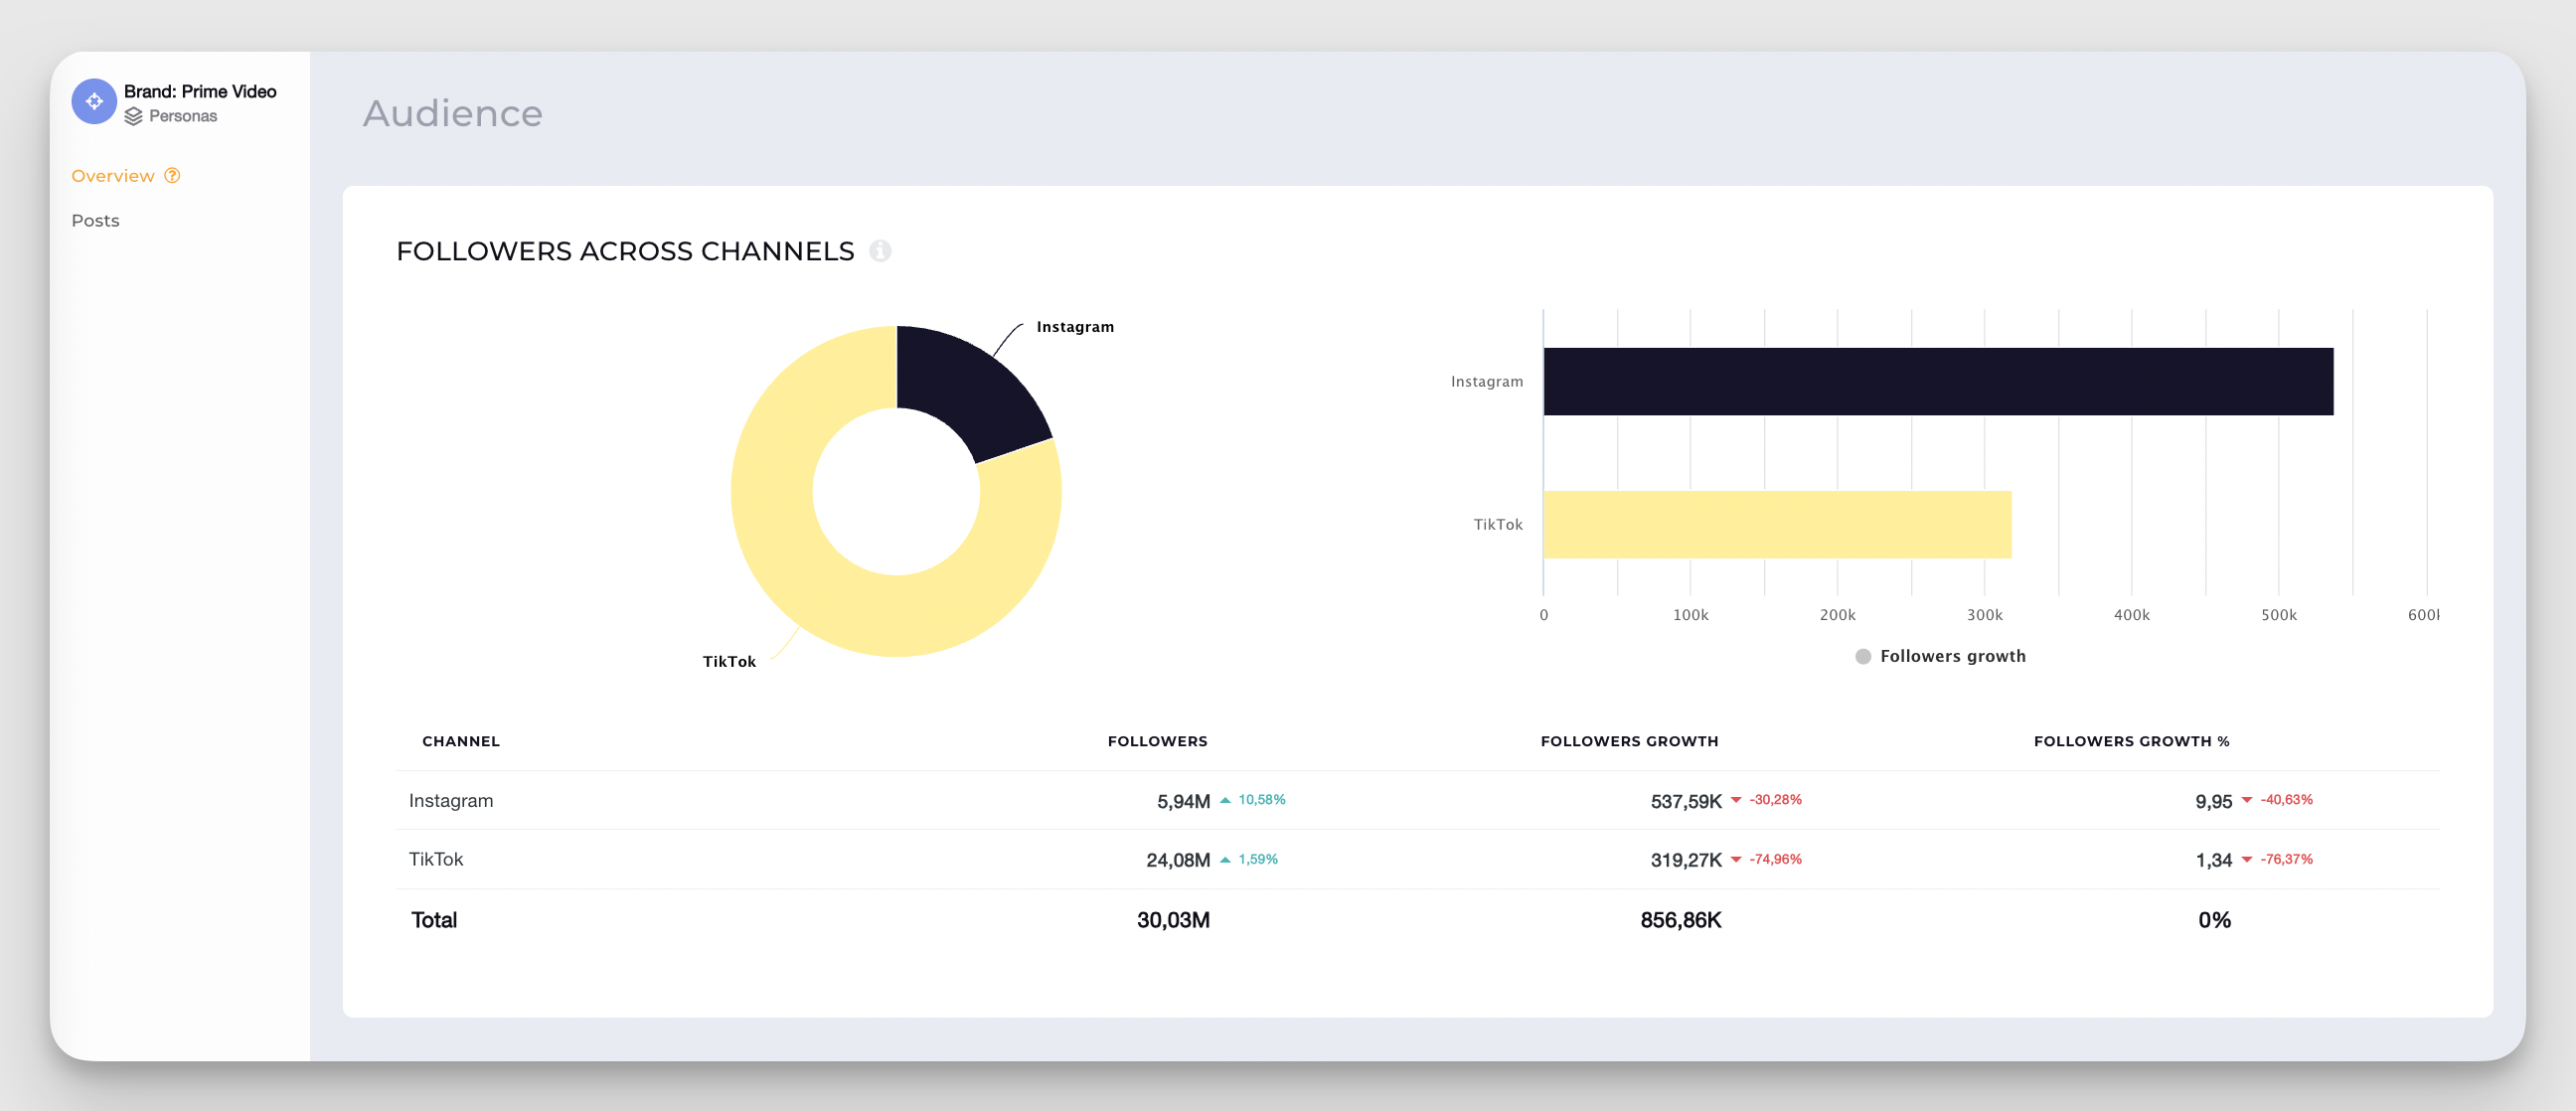
- Followers and follower growth rate: This shows how quickly your audience is expanding over a specific period.
In my report, I compare growth across platforms and time periods to talk about where my audience is accelerating and what might be driving the change.
I love how Socialinsider also provides me with historical follower growth analysis, allowing me to see my growth over the years.
- Demographics: Demographics show the age, gender, location, and other key traits of the audience you’re reaching.
Show if they are matching against your ideal customer profile and denote shifts that signal new opportunities or misalignment.
- Audience sentiment: It shows how people feel about your brand by analyzing positive, neutral, or negative mentions.
In your social media report, evaluate sentiment by monitoring changes over time and comparing spikes with specific events, campaigns, or content pieces to understand what’s shaping audience feelings.
Teddy prioritizes this metric when analyzing audience metrics:
I would suggest looking beyond demographics too. I track cultural cues, sentiment, and content themes. For instance, our KSA audience engages more with Arabic-first posts that feel native to the region. Those kind of nuances are gold.
Engagement metrics
Engagement analysis metrics show how actively people interact with your content through likes, comments, shares, saves, and clicks.
Include them when your goal is to understand content relevance, audience interest, or how well your posts encourage participation.
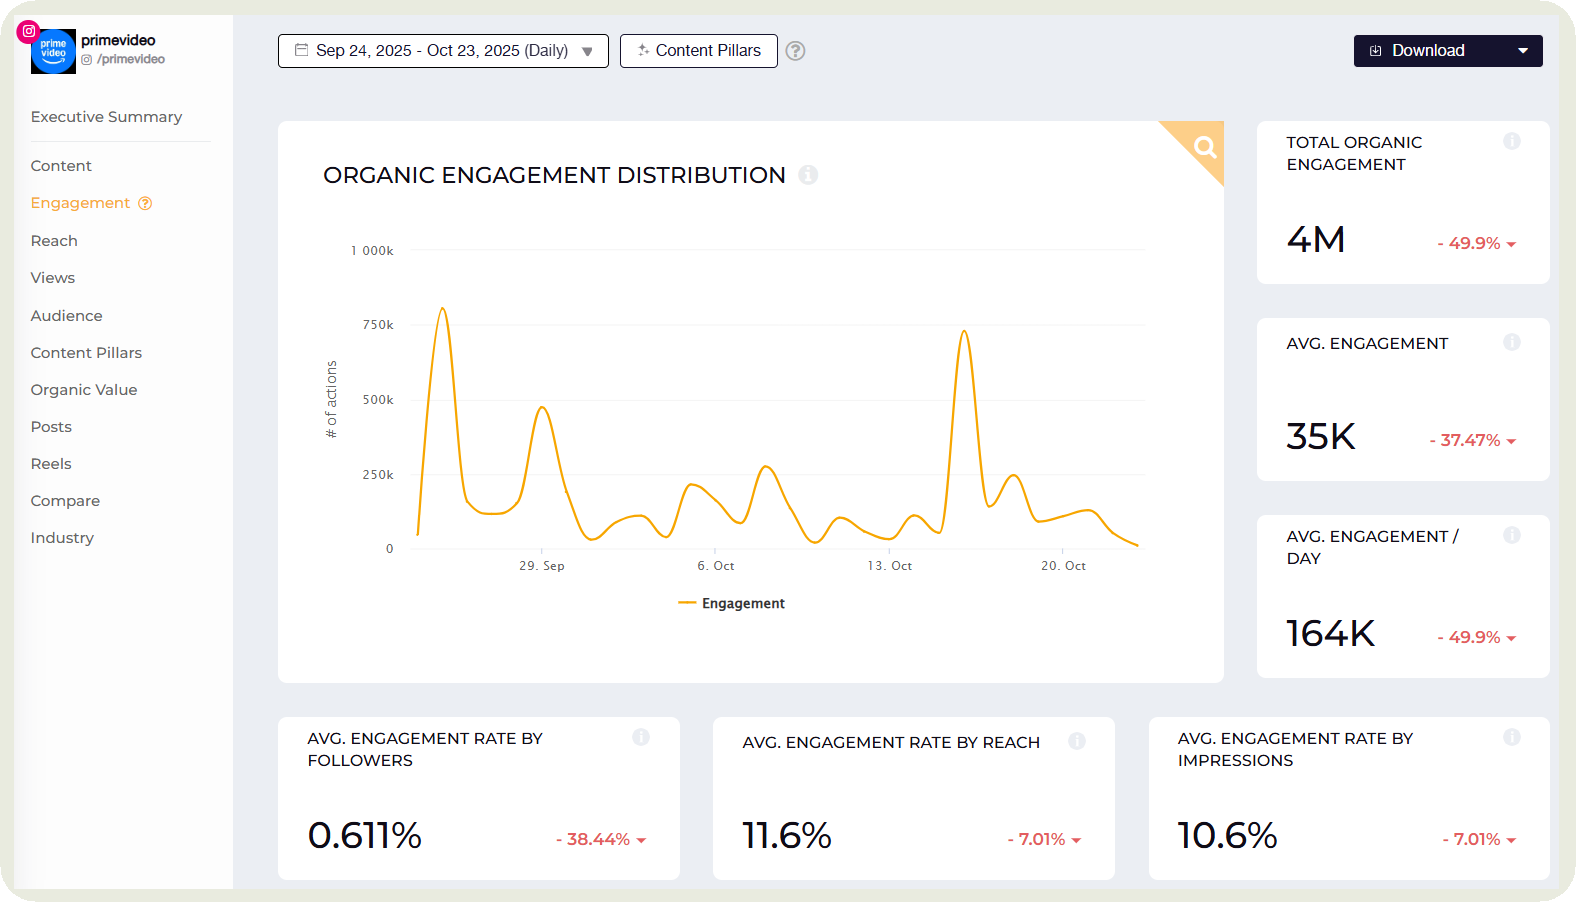
- Total engagement: It measures the combined interactions your content receives across likes, comments, shares, saves, and clicks.
Evaluate total engagement by comparing it across posts, campaigns, and platforms to identify if it grew over that specific period.
- Engagement rate by followers and reach: Engagement rate by followers and reach shows how actively people interact with your content relative to the size of your audience or the number of people who actually saw the post.
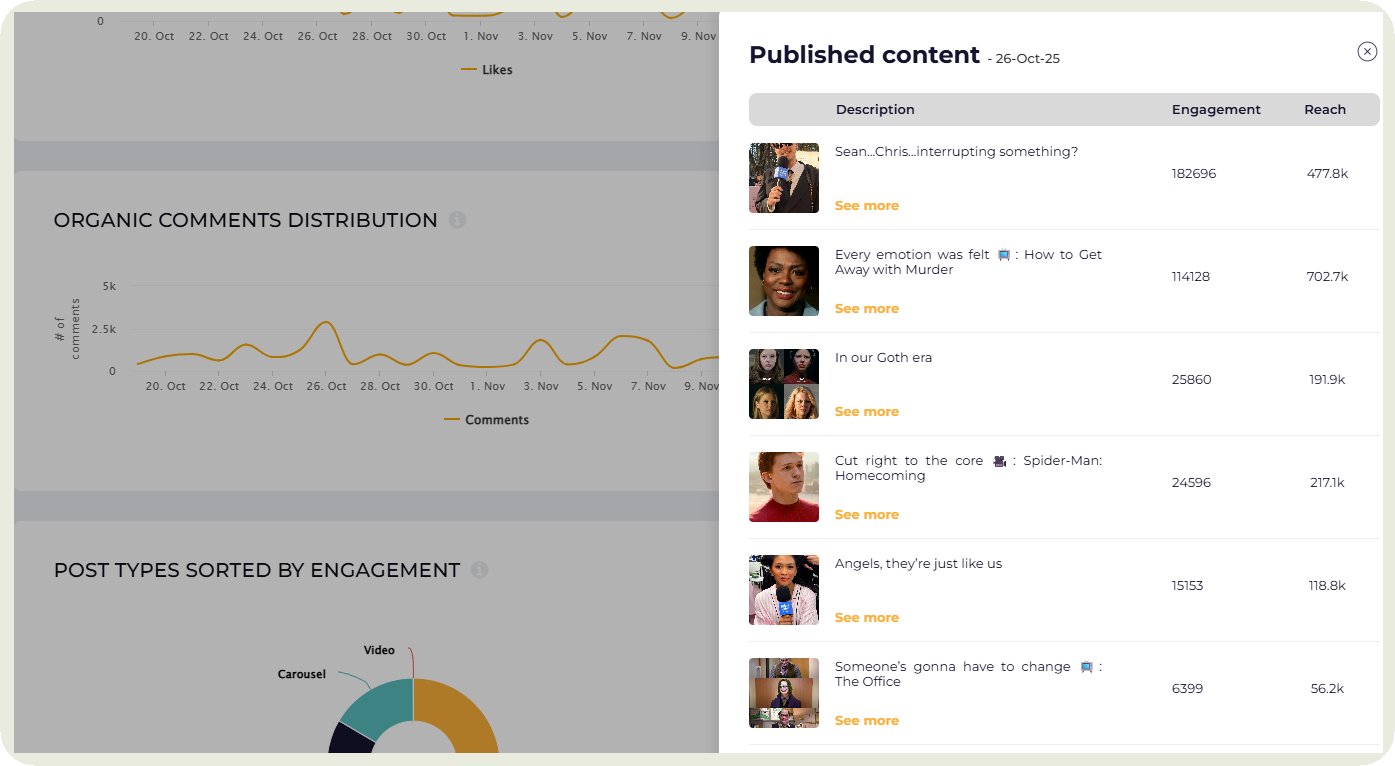
- Comments, shares, and saves: Comments, shares, and saves show deeper forms of engagement that signal genuine interest, conversation, and long-term value.
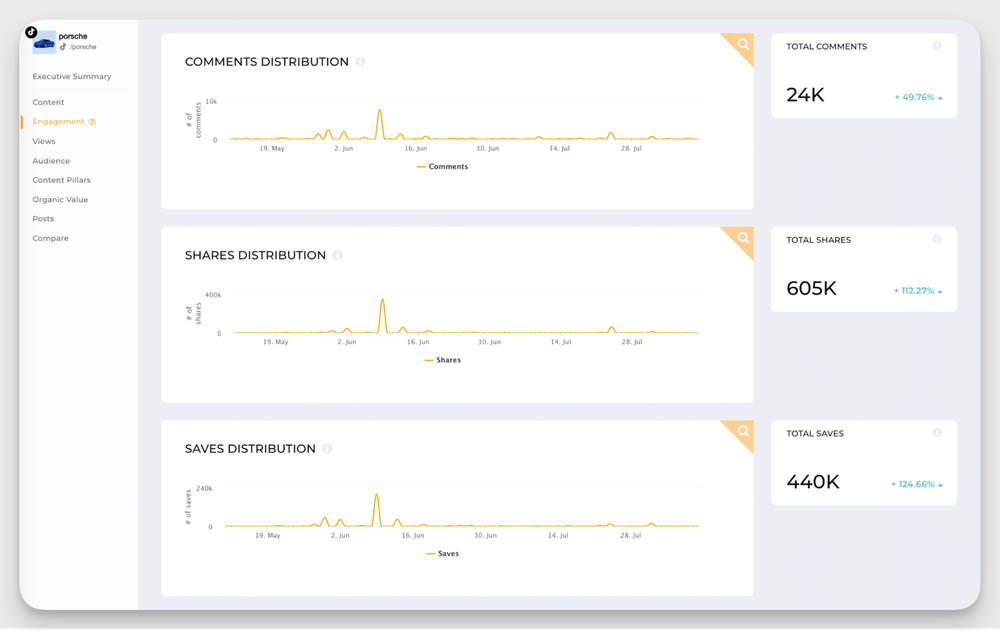
I even click on the sharp upticks and downfalls in the graph to demonstrate which posts led to a lot of comments or shares.
- Post types by engagement: Post types sorted by engagement show whether videos, carousels, images, or text posts generate the most interaction.
If you’re qualifying which format to focus on next, this is the metric you should show in your report.
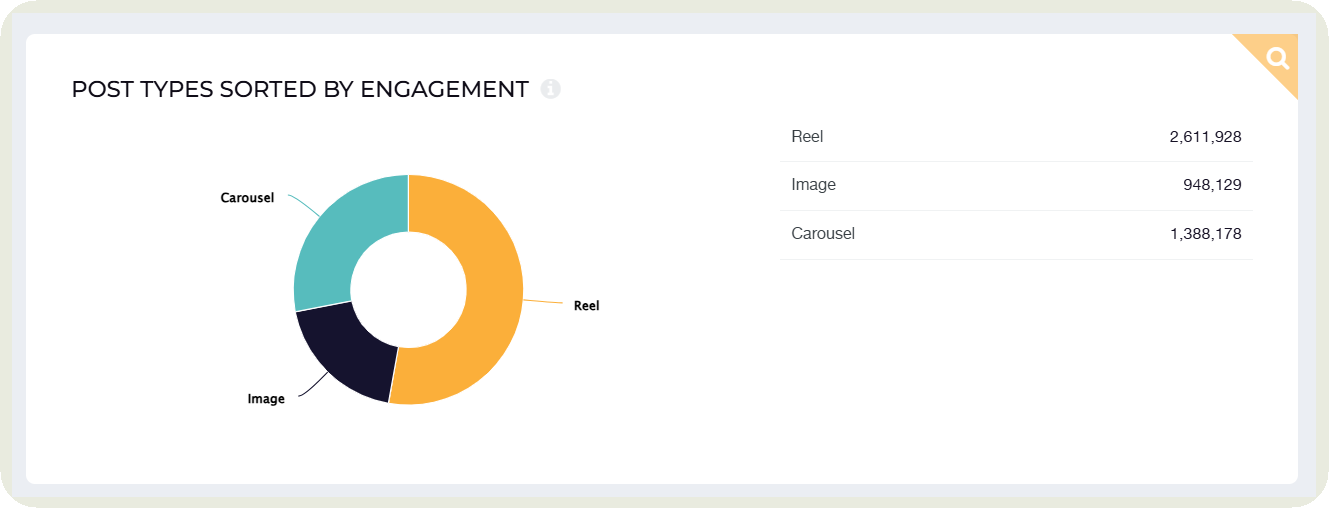
I look at this across platforms too. When short-form videos top the charts on Instagram and YouTube, I know I can reuse the same piece and get double the output with half the work.
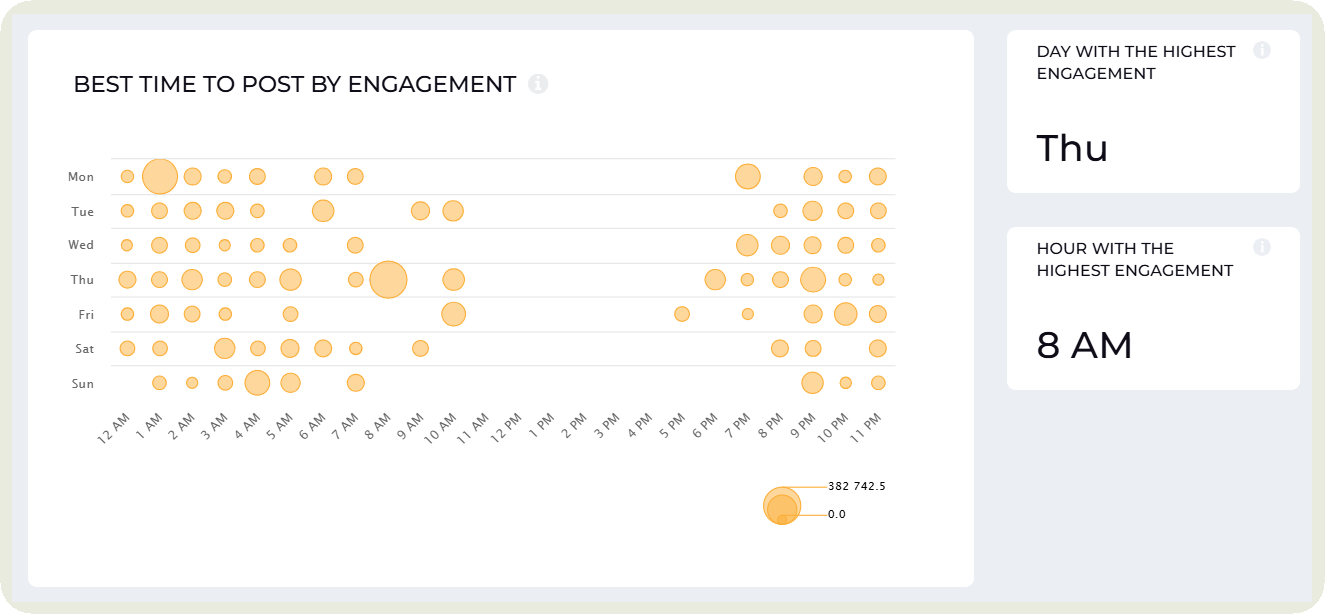
- Best time to post by engagement: Wondering when to post on social media? Instead of following random timeframes, Socialinsider shows you the time that will get you the highest engagement.
Content performance analysis
Content performance metrics show how each post, format, or theme actually delivered in terms of engagement, reach, and clicks.
I include them in my report when the goal is to understand what resonates, refine content strategy, or guide future creative decisions.
- Content format performance: Did carousels work the best on Instagram? Were Reels the highest comment driver on Facebook?
Note down how each content format performed in terms of engagement, conversation drivers, and clicks.
- Top and bottom-performing content: This shows which posts drove the strongest results and which fell flat. Instead of just adding this content to the social media marketing report, point out the common themes in both.
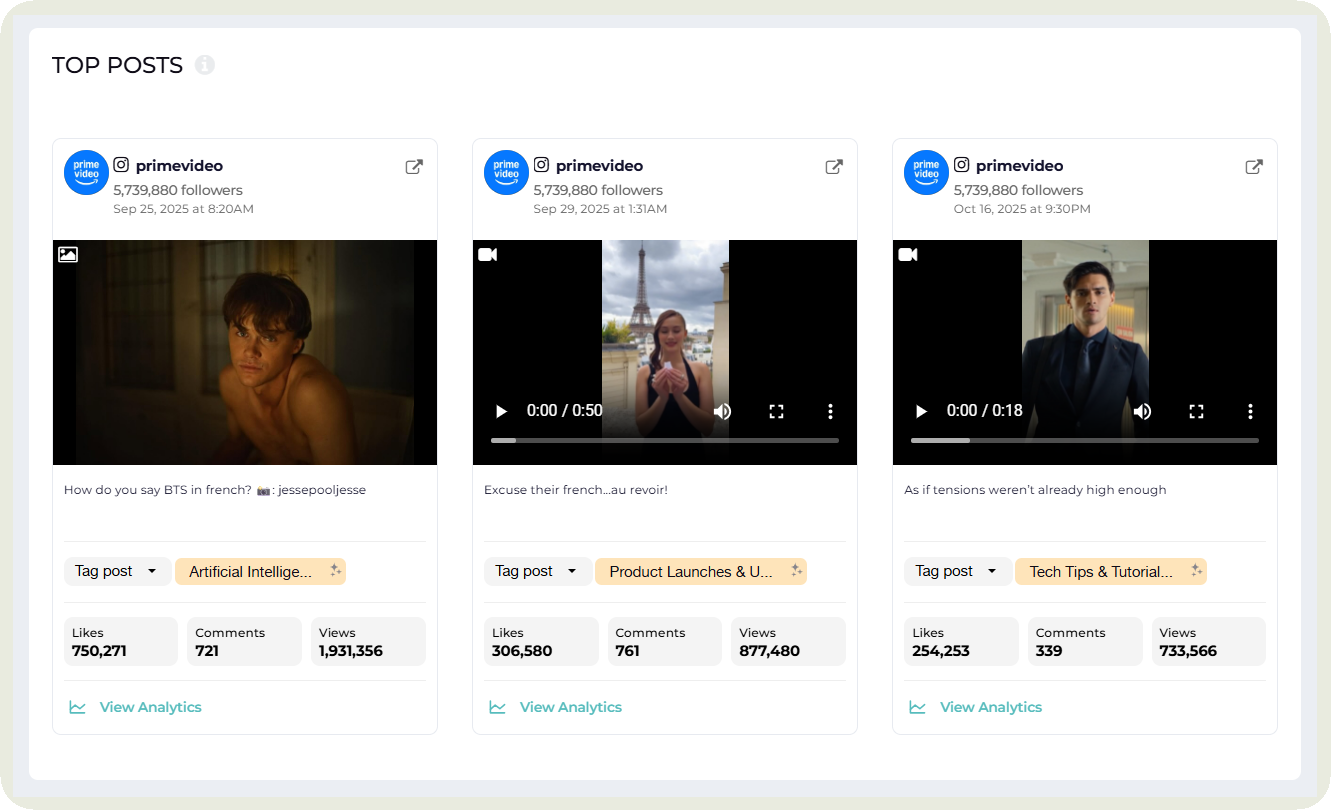
Did posts fall flat because of ineffective captions? Do all the top-performing posts come from the same content theme?
I also like to add recommendations for content based on this analysis.
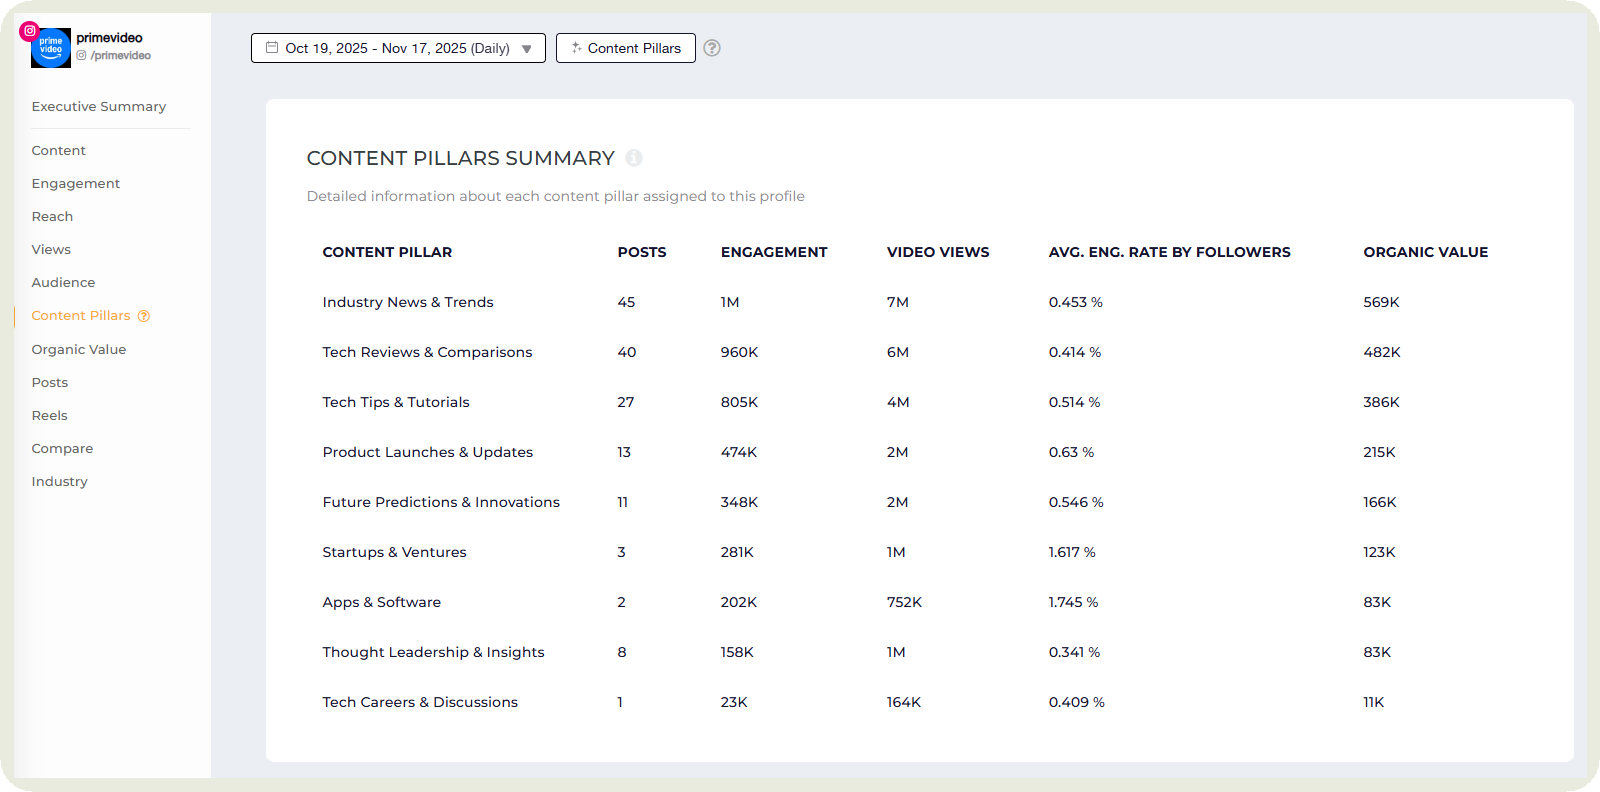
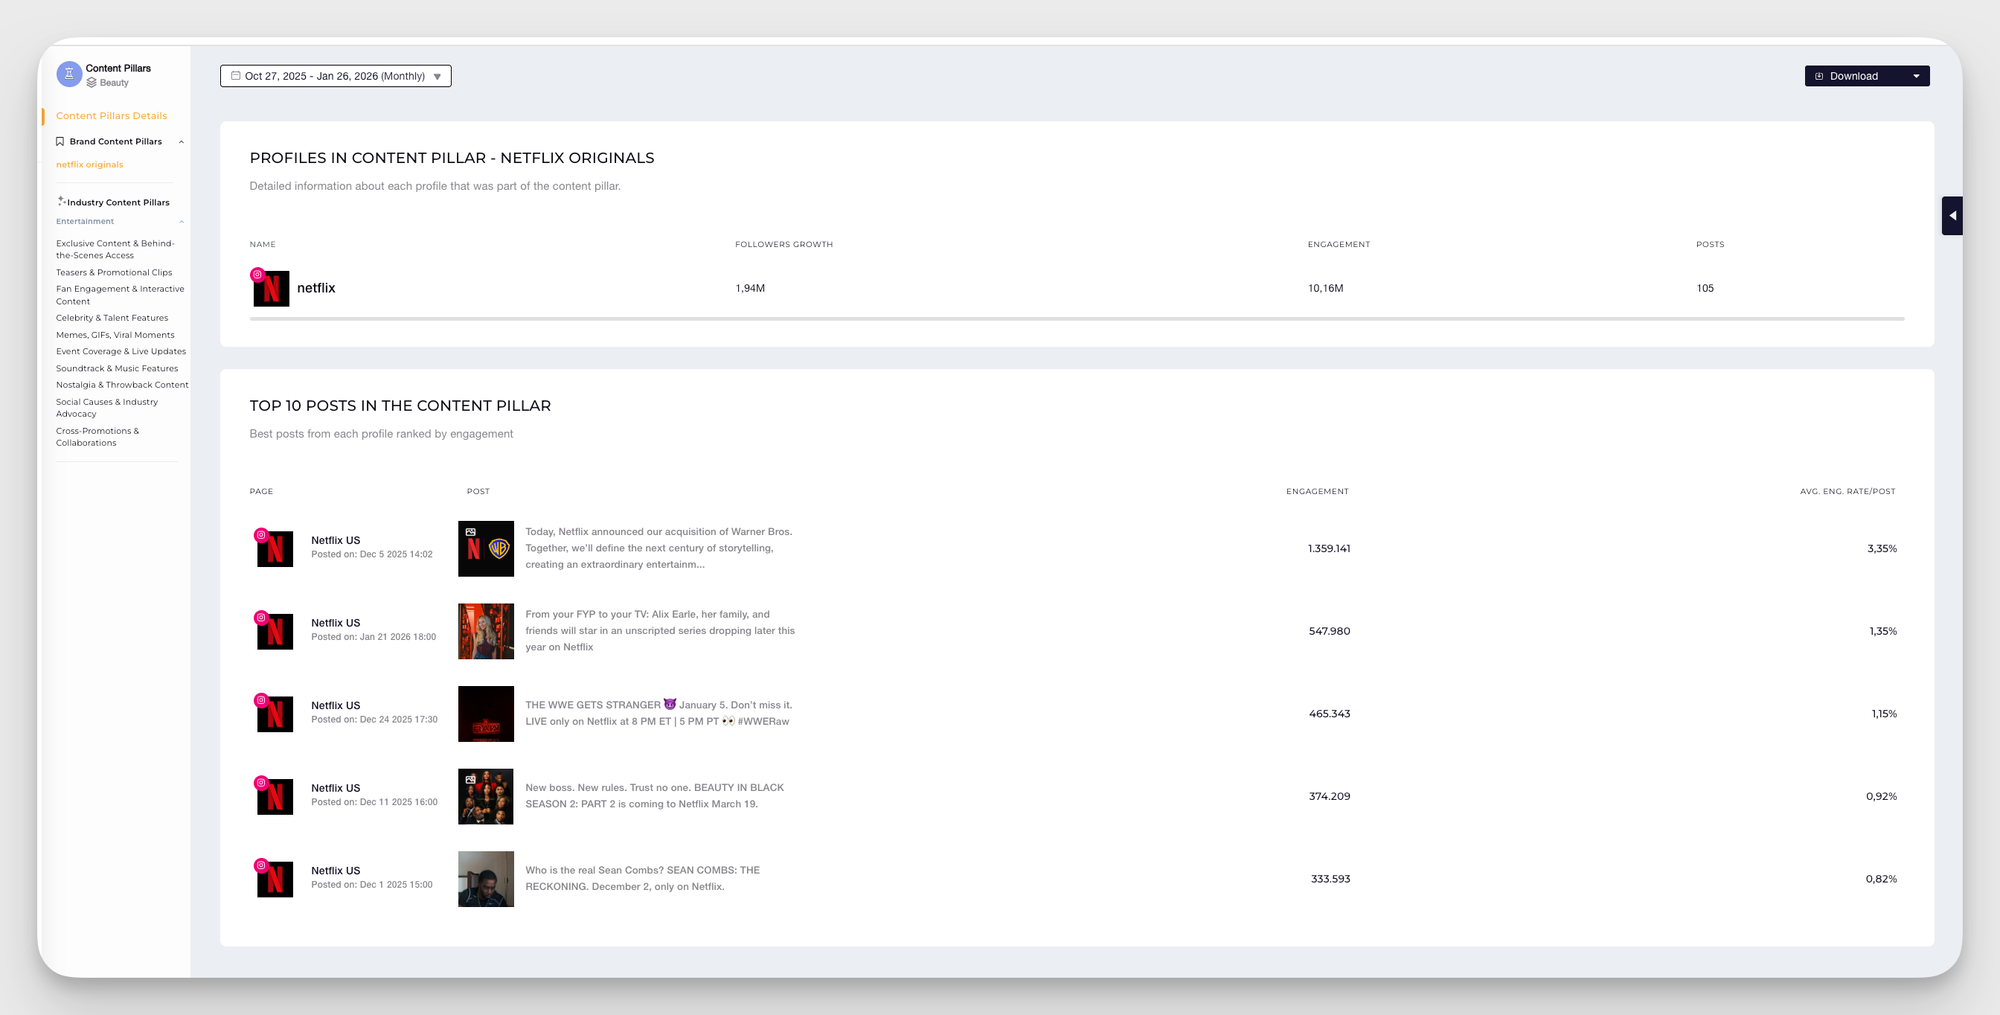
- Content pillar analysis: It shows how each theme or category contributes to your overall results.
When I asked Teddy about how he goes through analyzing content pillars for clients like Nokia and Oppo, he mentioned:
I check for balance, clarity, and purpose. Each pillar must serve a role: awareness, engagement, or conversion. Then we reweight the mix monthly based on performance and campaign goals.
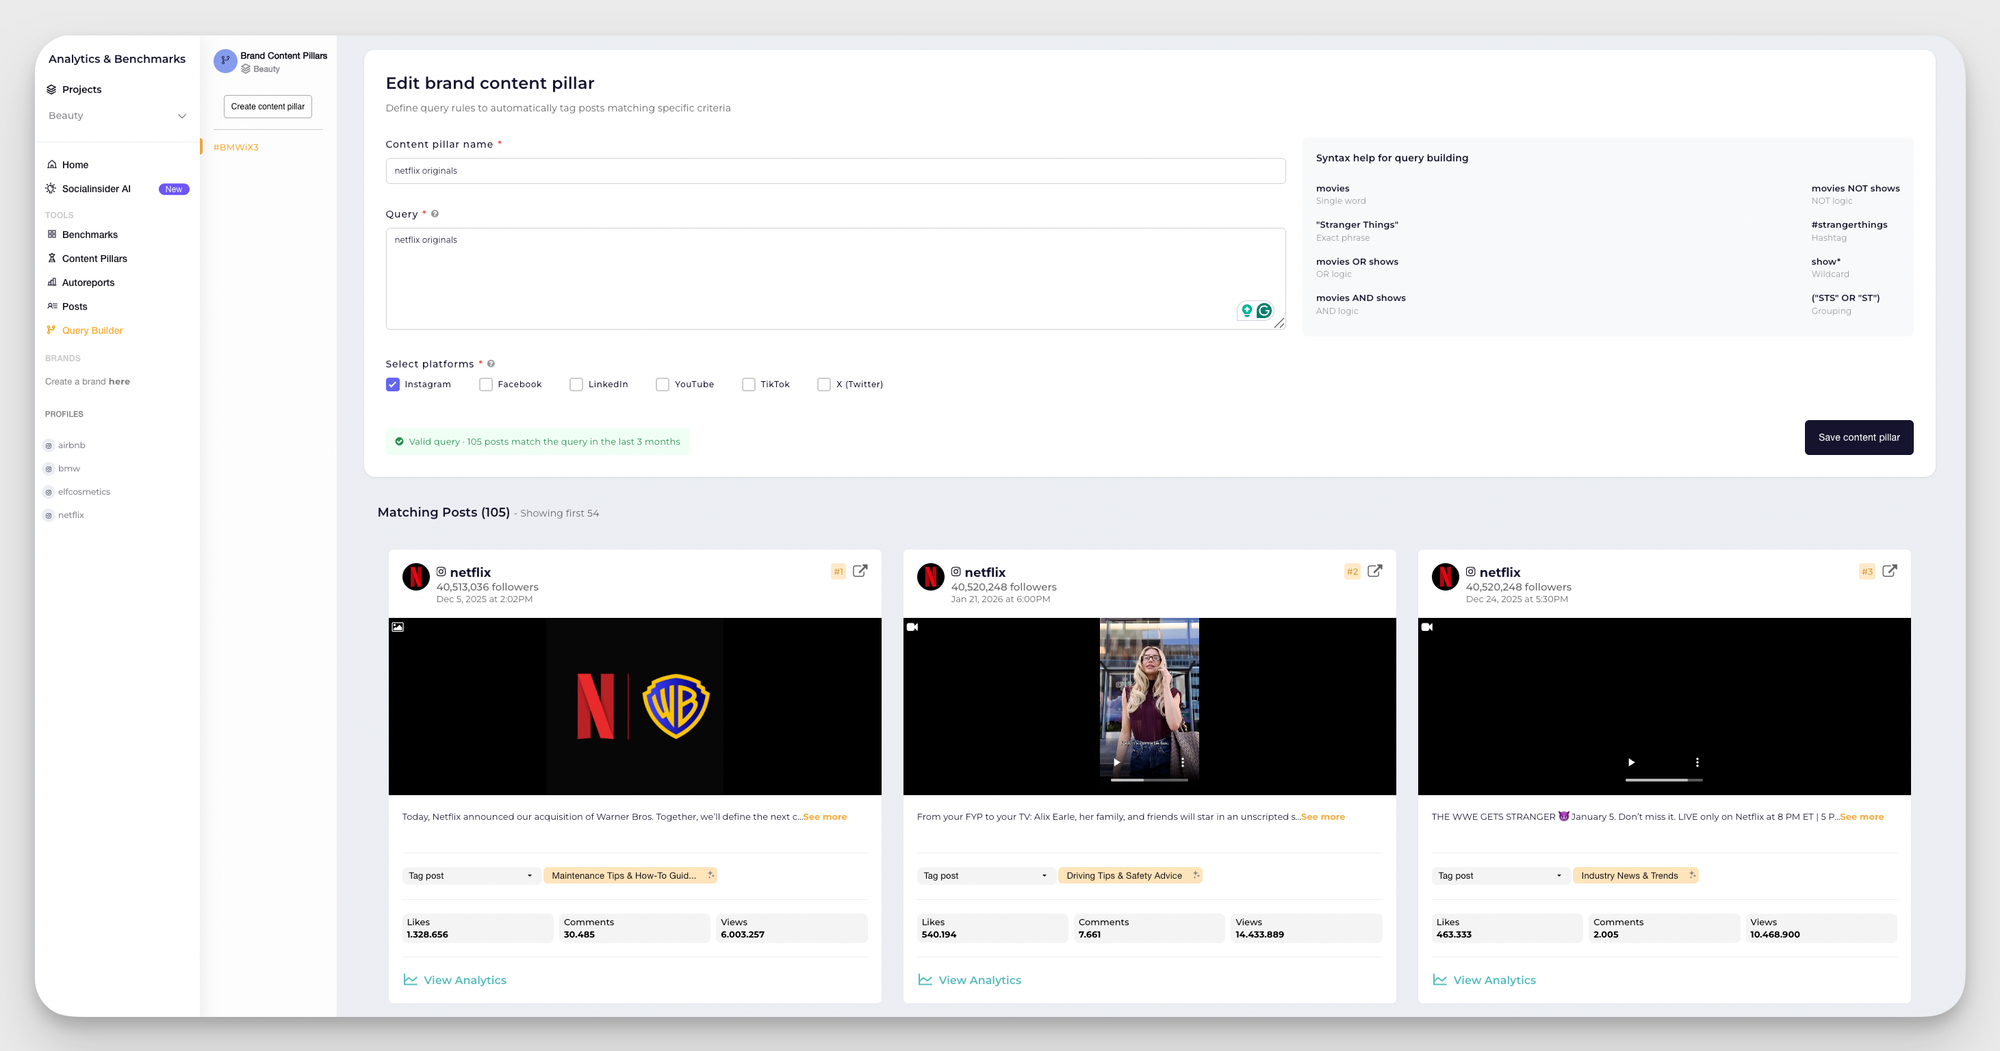
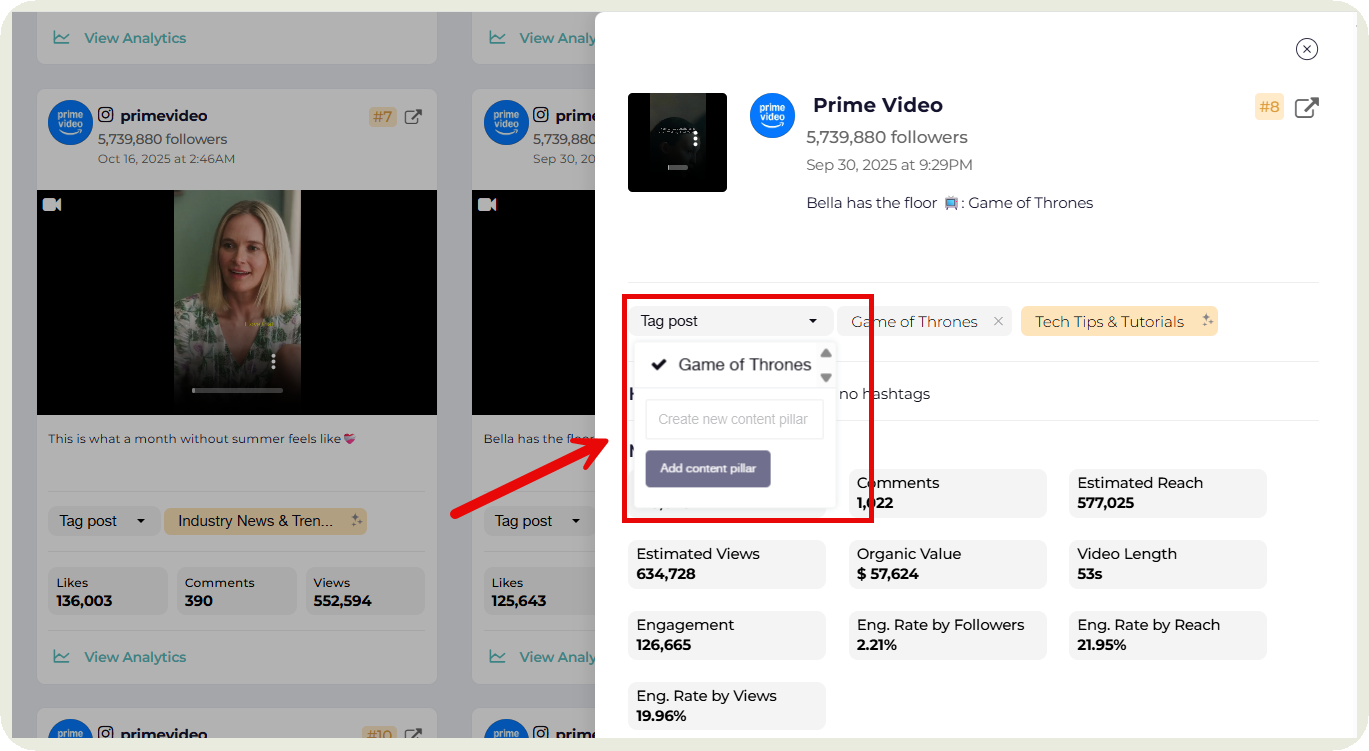
- Campaign content analysis: If you run a lot of campaigns, use Socialinsider to tag posts under specific campaigns and compare how different campaigns performed in terms of engagement, organic value, and views.
- Video analysis: Video analysis shows how your video content performs through metrics like views, retention, watch time, and engagement.
I track it by comparing retention curves, engagement patterns, and performance across platforms to see what style, length, or hook delivers the strongest results.
Competitor and industry comparison
Effective social media reporting goes beyond tracking your own numbers—it’s about understanding your position in the market. That’s where competitive benchmarking comes in.
- Insightful performance benchmarks: Socialinsider makes this process straightforward. You get a clear, top-level view of how your brand stacks up against competitors, all in a single dashboard. Benchmarking your performance isn’t limited to looking at one or two metrics.
Socialinsider breaks down competitor data across every important channel, so you can compare your engagement, follower growth, content output, reach, and more—all side by side.
What’s more, Socialinsider doesn’t just stop at basic metrics. You can drill down into segmented performance data channel by channel, with access to specialized KPIs like organic value.
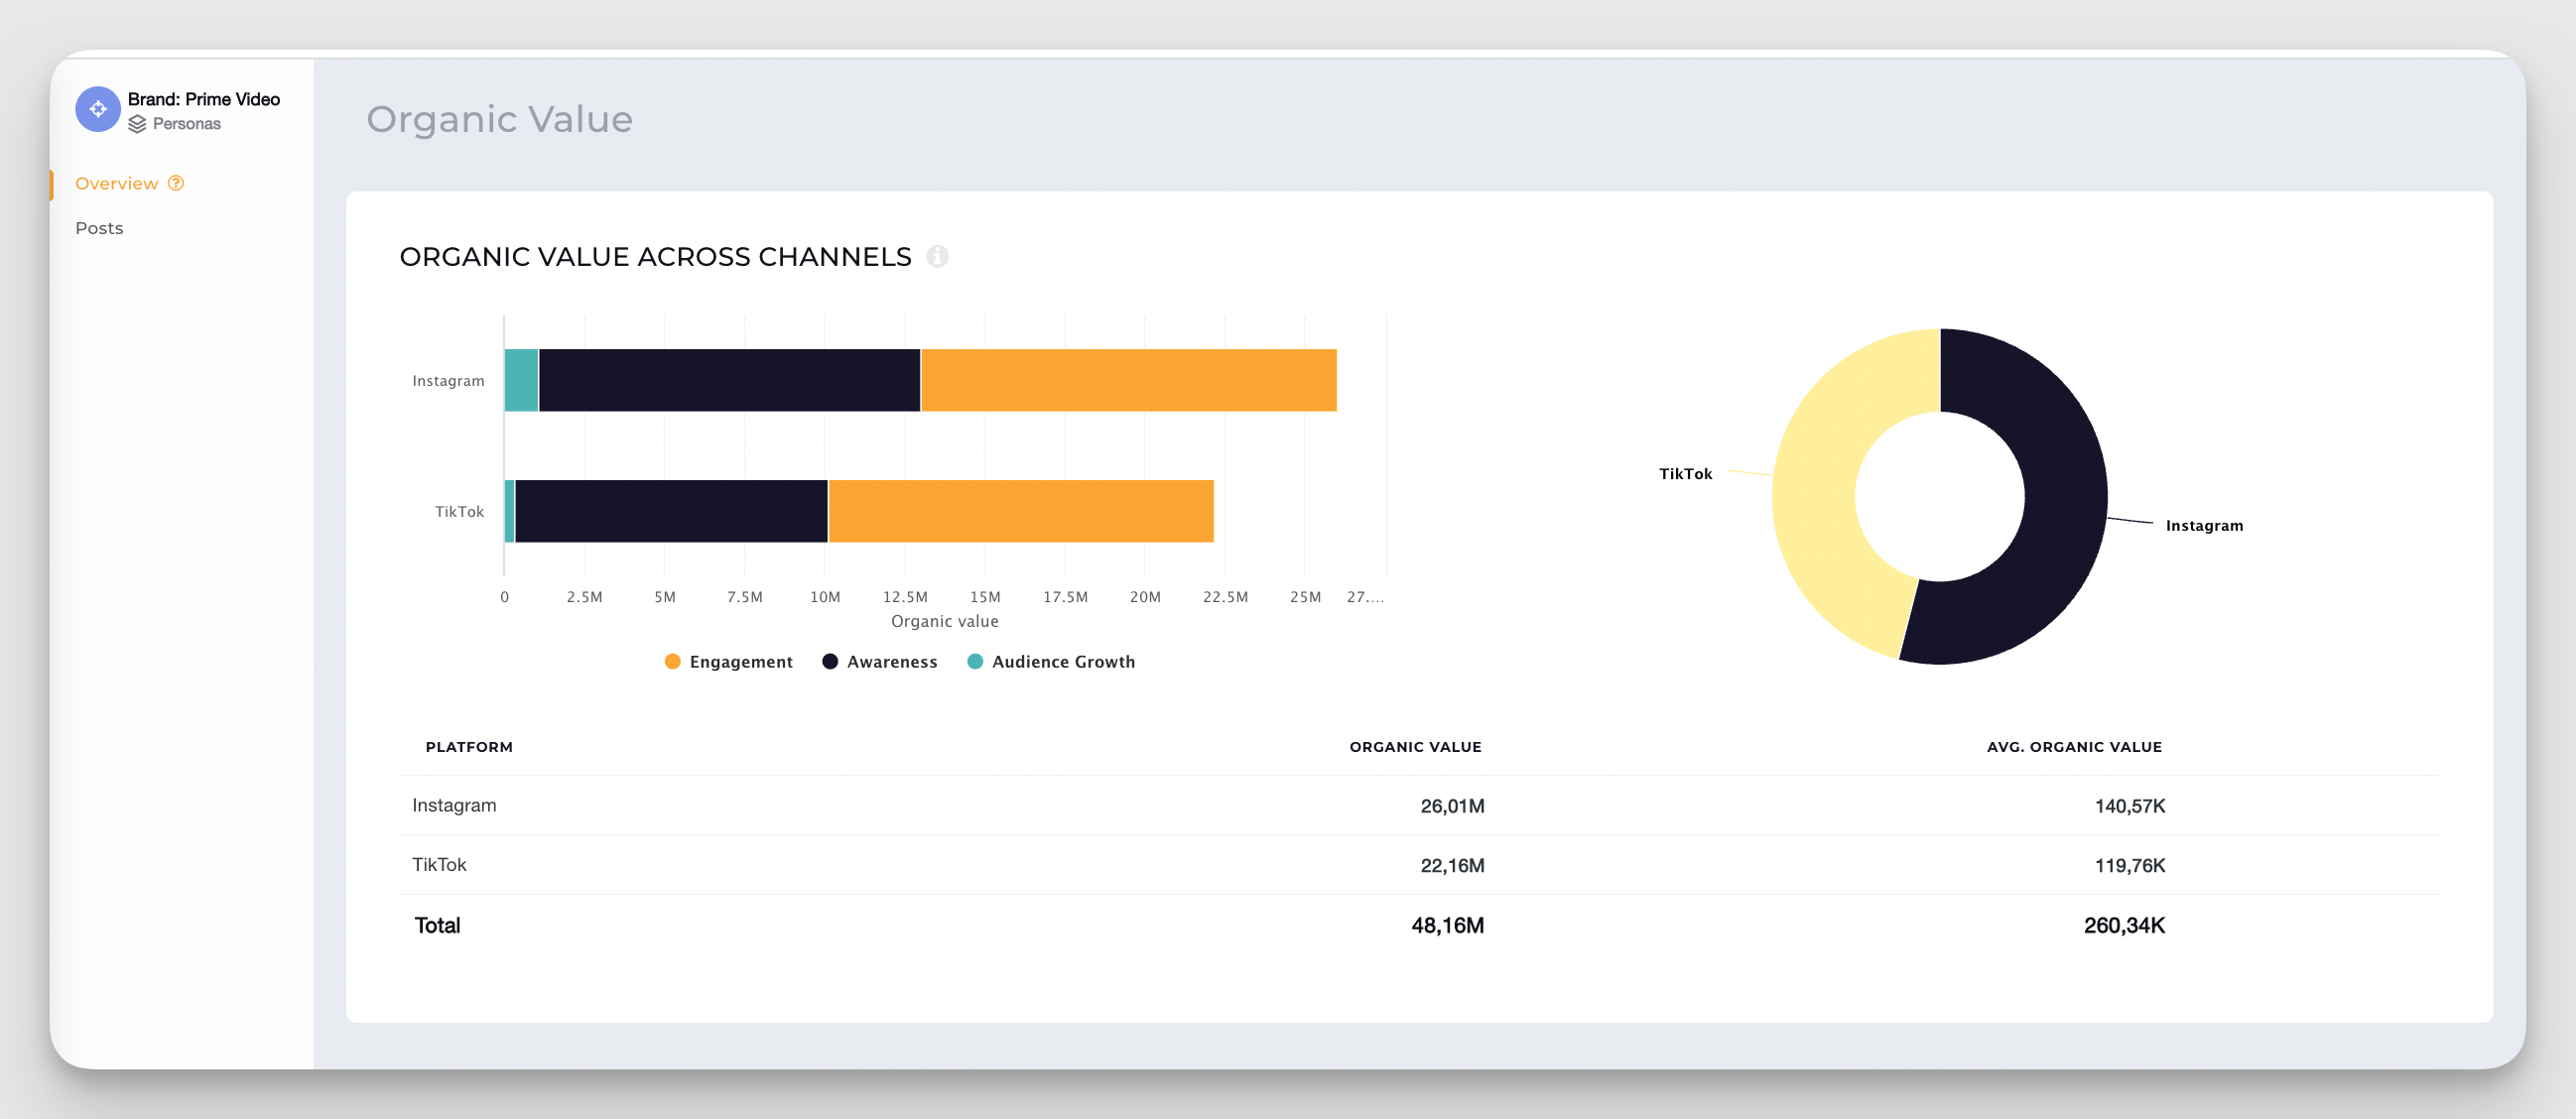
This is an essential layer in any mature social media reporting process, helping you justify strategy and spend, spot opportunities, and ultimately outperform your industry.
- Brand perception and sentiment: This analysis shows how audiences feel about your brand compared to others in your category.
Evaluate it by comparing positive, neutral, and negative sentiment trends side by side and reviewing spikes tied to specific events or campaigns.
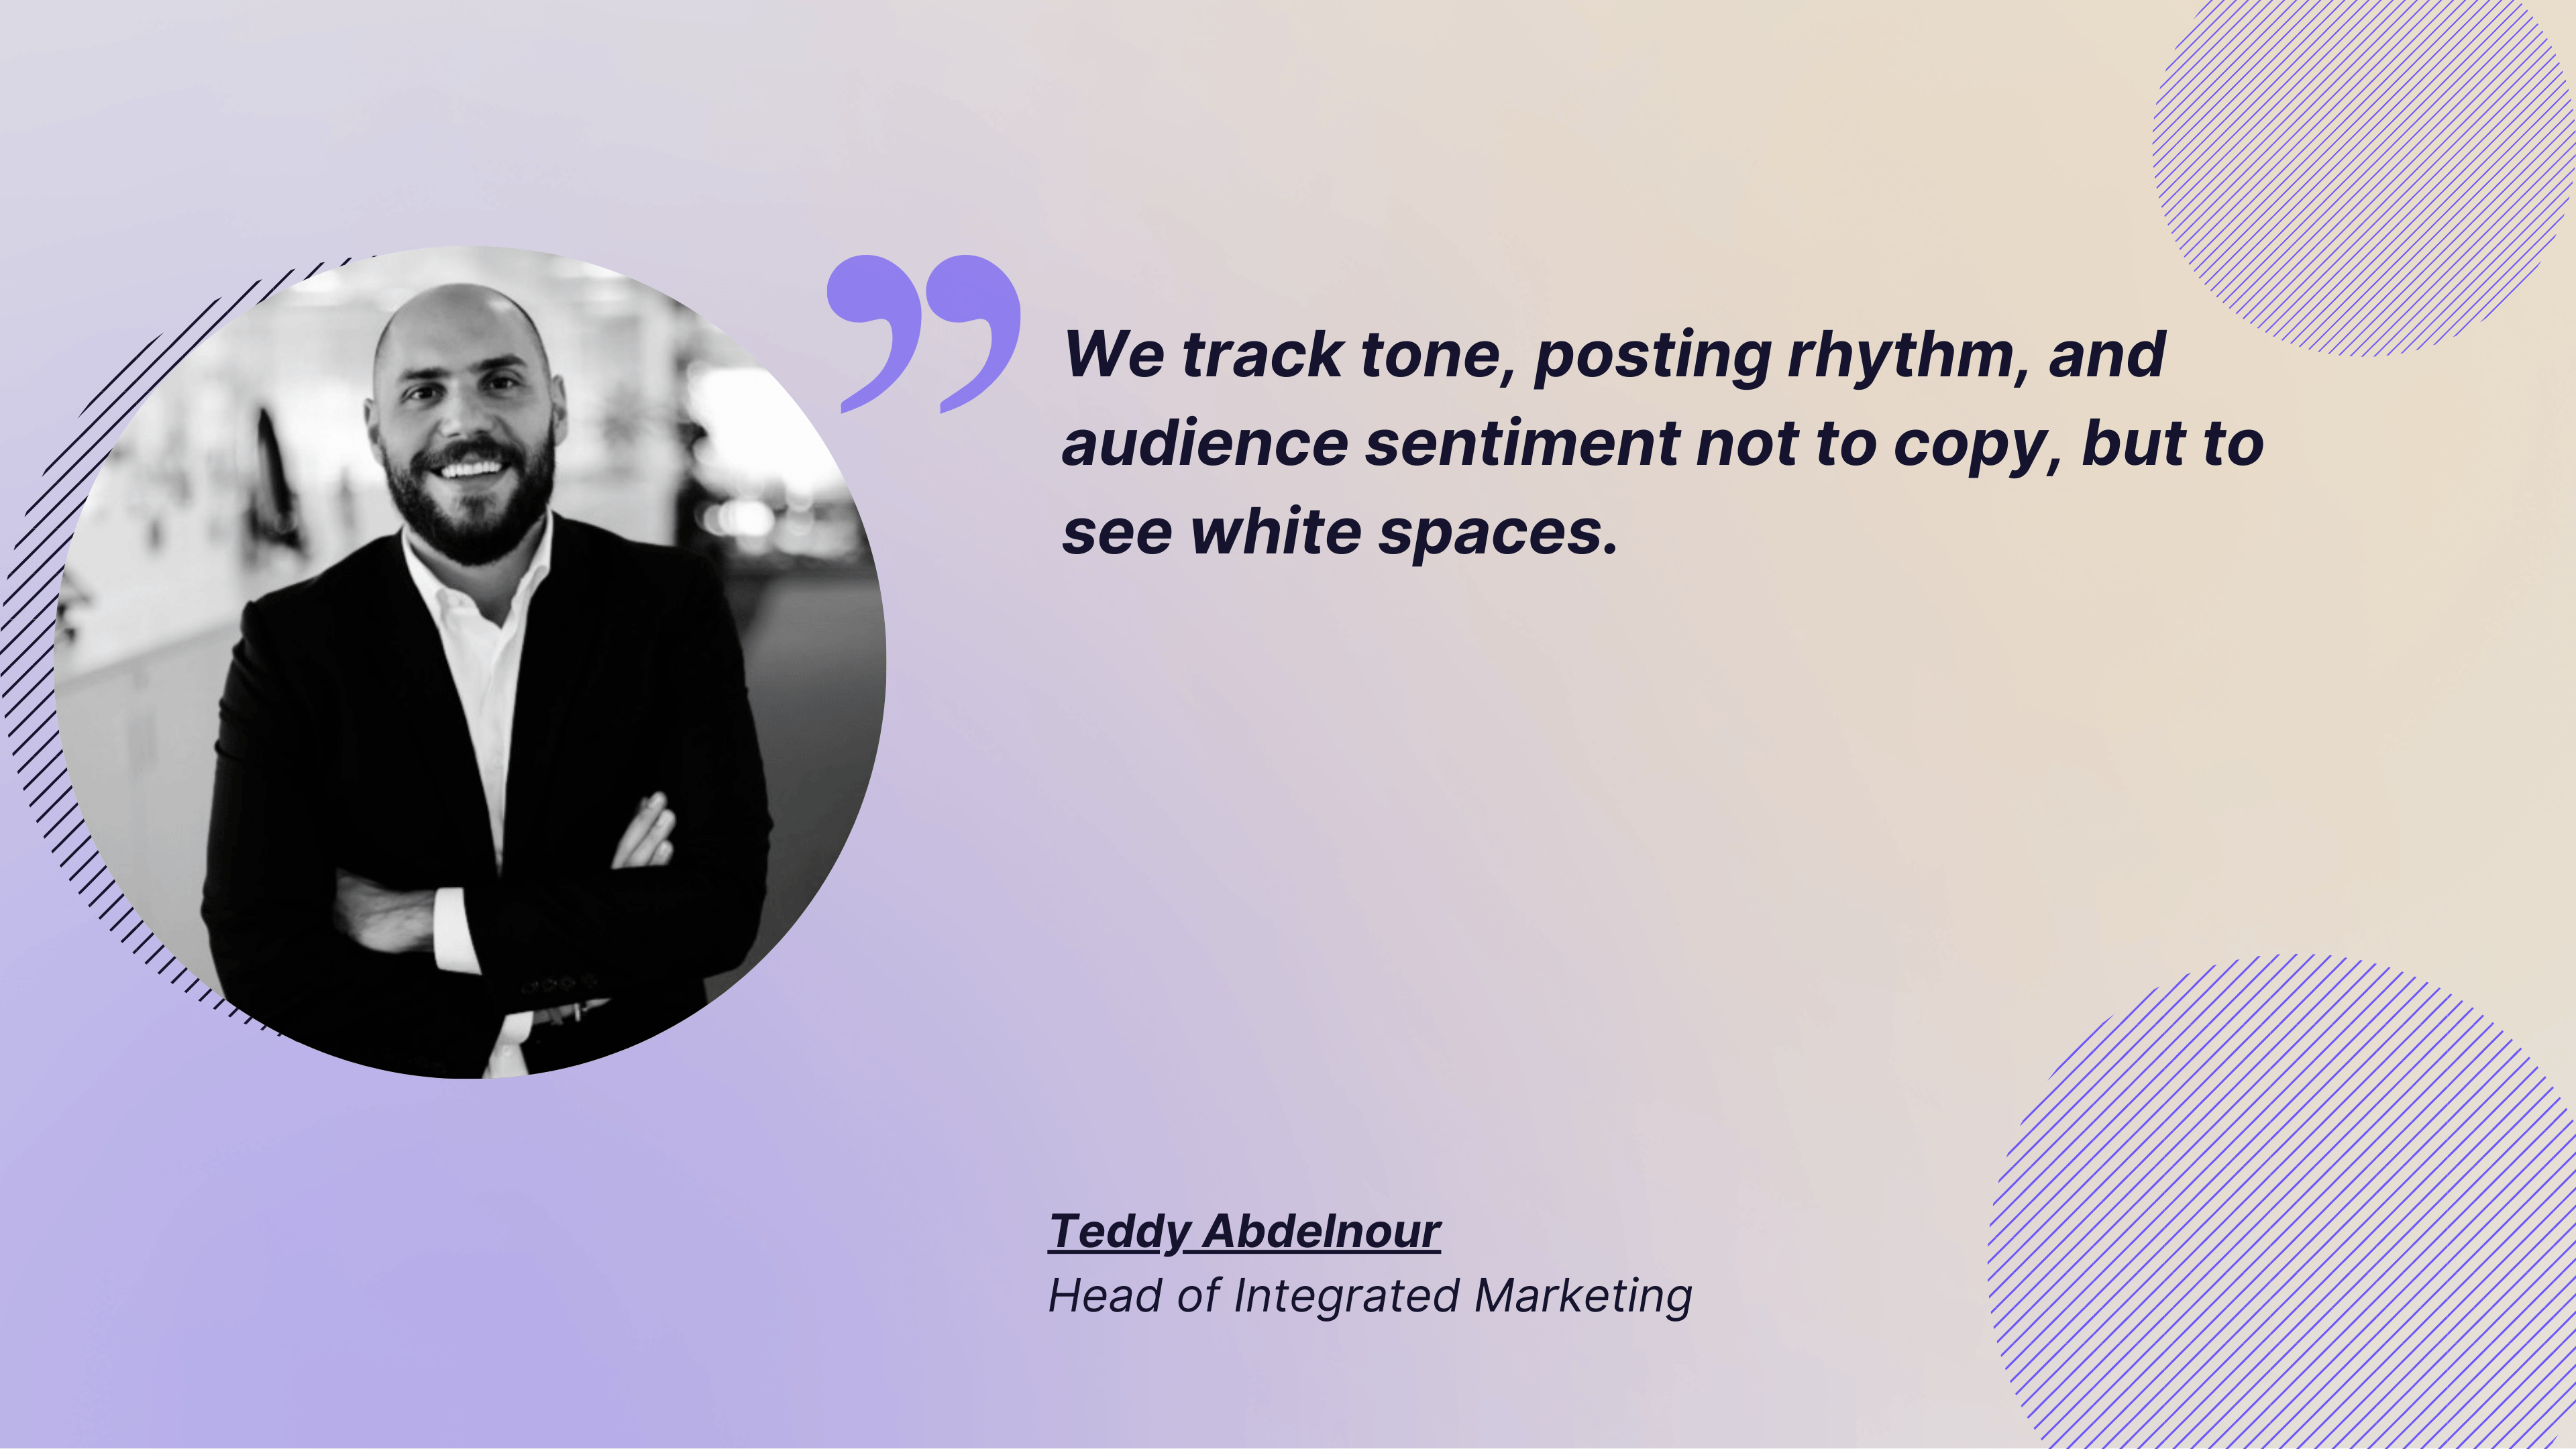
Here’s how Teddy goes about competitor analysis for his clients:
We track tone, posting rhythm, and audience sentiment not to copy, but to see white spaces. For example, when others were overusing AI visuals, we leaned into real creators for OPPO and saw stronger authenticity scores.
Paid media metrics
Paid media metrics show how your paid campaigns performed through results like reach, clicks, conversions, and cost efficiency.
Include them when your goal is to prove ROI, optimize ad spend, or understand which campaigns are actually moving the needle.
- Impressions and reach: They show how many times your ads were viewed and how many unique people saw them.
Compare them across campaigns and targeting groups to see which setups deliver the strongest visibility for the lowest cost.
- Conversion rate: Conversion rate shows the percentage of people who took the desired action after clicking or viewing your ad.
I like to see how different creatives, audiences, and platforms impact conversion rates. I also include this analysis in my report to showcase the type of creatives and platforms we need to focus on for paid media.
- Revenue generated: It tracks how much money your paid campaigns directly contributed.
You can even calculate revenue per campaign if you’re running multiple ad campaigns to see which ads brought the highest revenue.
- Cost per click (CPC): Cost per click shows how much you pay each time someone clicks your ad.
Evaluate by comparing CPC across different ad variations and target groups to identify what brings qualified traffic at the best cost.
Free social media report template for download
Now you know everything to create that perfect social media analysis report. But we understand that your plate may be already overflowing with campaigns, content planning, and last-minute approvals. You don’t need another task eating up your time.
So here’s a shortcut. Grab this ready-to-use social media report template and jump straight into presenting your results.
Best social media reporting tools
You want to make the reporting process as easy as possible. Here are three tools we use in our team.
Native analytics
Native analytics give you the closest view of how your content performs on each platform. Meta, LinkedIn, TikTok, and YouTube all tell you exactly what your audience did, when they did it, and how they interacted with every post.
If you’re just starting or you want data for free, these analytics are your best bet.
Socialinsider
Socialinsider gives you the bigger picture that native analytics can’t. While native dashboards show what happened on one platform, Socialinsider pulls everything together so you can compare channels, track trends, and spot patterns without juggling five tabs.
It shines in the areas where native tools fall short. You get competitor benchmarking, cross-platform analysis, historical data beyond native limits, and clean visuals you can drop straight into reports.
Google Analytics
Google Analytics shows you what happens after someone leaves a social platform and lands on your website. It connects your social efforts to real on-site behavior, helping you see which posts, campaigns, or channels actually drive traffic, conversions, and revenue.
Use it to track UTM performance, time on page, bounce rate, assisted conversions, and the full journey from social click to final action. I use it to answer big questions fast: Which platform brings the most qualified visitors? Which campaigns lead to sign-ups or purchases? Where are people dropping off?
Social media reporting tips
To get the most effective report across to your team and clients, here are four social media reporting tips you can follow.
- Report impact in language leadership understands. Instead of talking about impressions or reach, show how those numbers influenced pipeline, conversions, revenue, or market visibility.
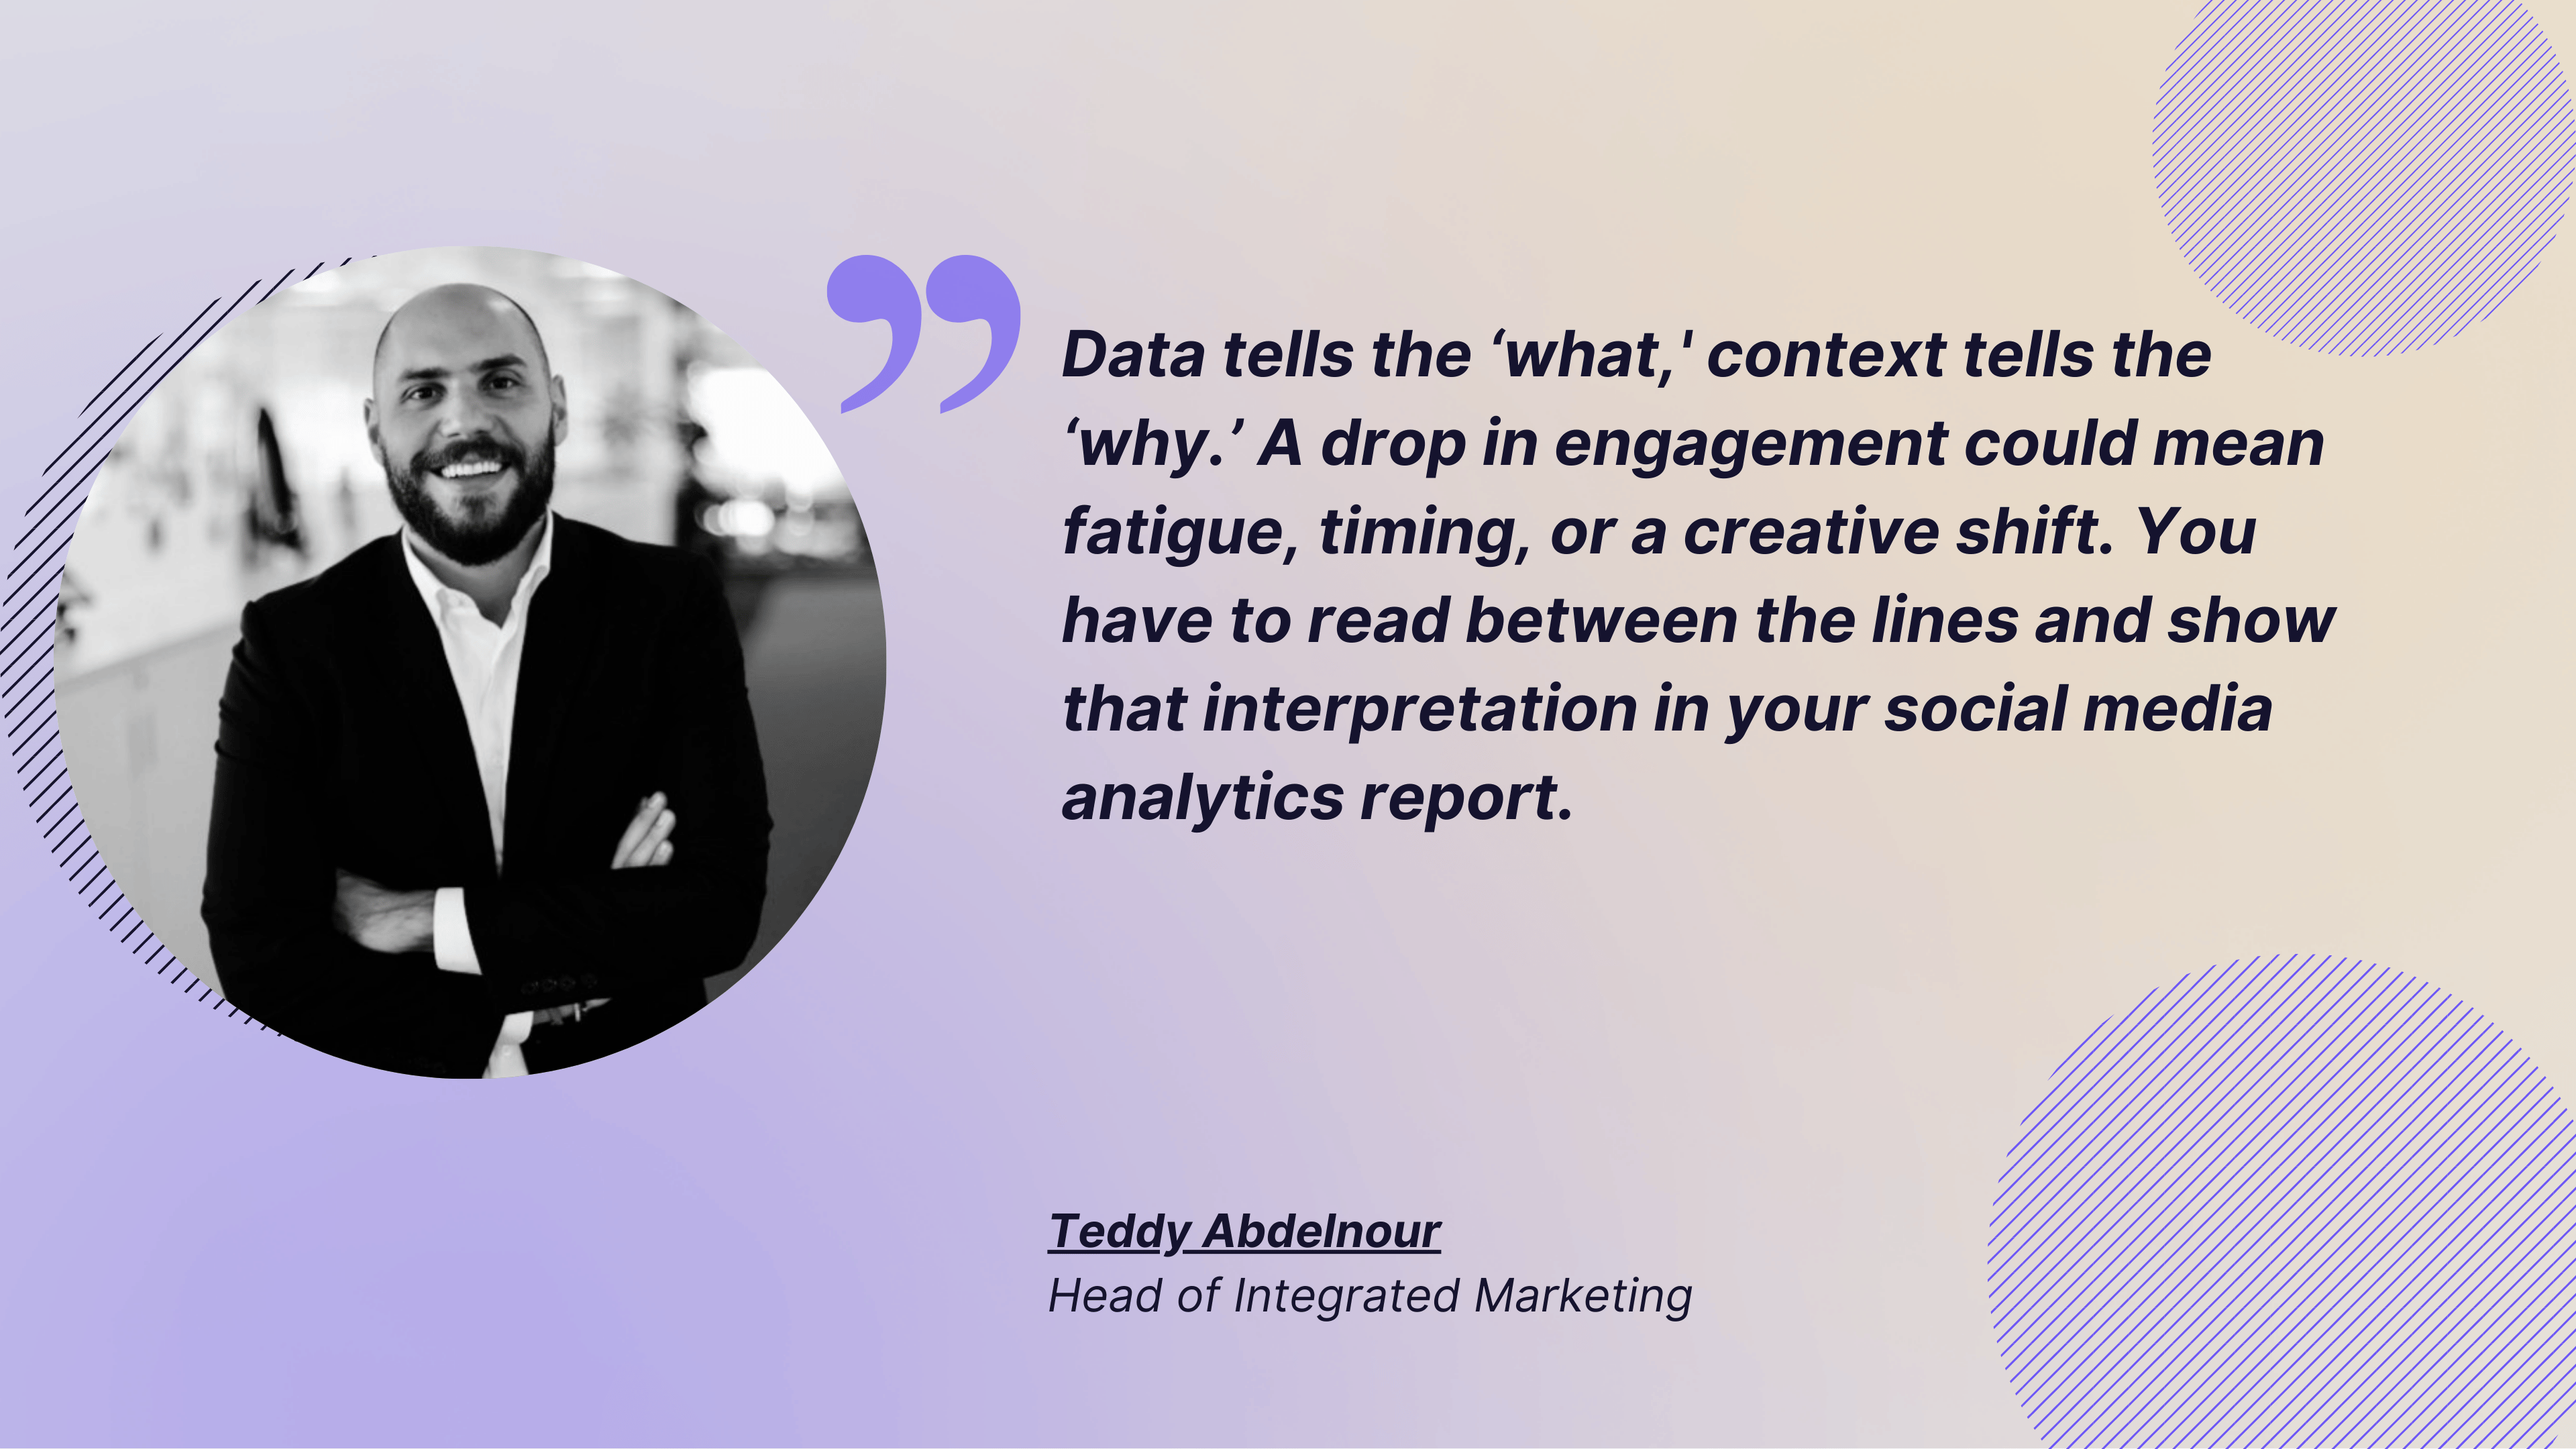
Teddy mentioned the same when he said:
Data tells the ‘what,' context tells the ‘why.’ A drop in engagement could mean fatigue, timing, or a creative shift. You have to read between the lines and show that interpretation in your social media analytics report.
- Don’t overload the report with data. Too many numbers dilute the message and make it harder for stakeholders to see what matters. Focus on the metrics tied to goals, highlight the shifts that need action, and keep the rest in the appendix for anyone who wants to dive deeper.
I also like to present dashboards sometimes to give quick reporting on important KPIs.
- Make your report easy to scan. Use clear headings, short sections, visuals, and quick takeaways to guide readers through the insights. Your stakeholders should not get lost in pages and pages of data.
- Utilize AI features in analytics tools: AI can help speed up reporting and surface insights you might miss manually. For example, using Socialinsider’s AI assistant, you can highlight performance shifts, flag opportunities, and summarize patterns across platforms in seconds.
Final thoughts
A strong social media report does more than recap numbers. It shows what changed, why it matters, and what to do next.
While creating your report, keep your story tight, highlight the shifts that deserve attention and connect everything back to business outcomes so leadership understands the real impact of your work. And remember to keep refining your social media performance report as your channels evolve.
If you want to save time by monitoring performance quickly and easily, try Socialinsider for free and explore its different reporting features.
FAQs on social media report
What are the benefits of consistently creating social media performance reports?
A social media report helps you understand what worked, what didn’t, and what to do next. It turns raw data into insights that leadership can act on. You can spot trends early, refine your content strategy, justify decisions with evidence, and improve future campaigns. It also keeps teams aligned and focused on the metrics that actually move results.
What are the types of social media reports?
Social media reports come in several types depending on your goals. You can create weekly or monthly performance reports, campaign-specific reports, competitor benchmarking reports, platform-focused reports, and executive-level summaries. Each type helps you track progress, understand impact, and make informed decisions based on the audience and purpose of the report.
Nidhi Parikh
Nidhi Parikh is SaaS writer that believes scrolling through social media is research for work. When not working, find her binge watching the latest series or reading anything she can get her hands on.

Know what your competitors do — before your manager asks
Get instant social benchmarks & reports without manual work.
You might also like


Improve your social media strategy with Socialinsider!
Use in-depth data to measure your social accounts’ performance, analyze competitors, and gain insights to improve your strategy.