Facebook 경쟁사 벤치마크와 분석을 한 곳에서 제공합니다
Socialinsider는 귀하의 페이지와 함께 모든 공개 Facebook 페이지를 추적합니다. 인게이지먼트, 성장, 콘텐츠 전략을 비교하세요. 수치 보고에만 그치지 않습니다.


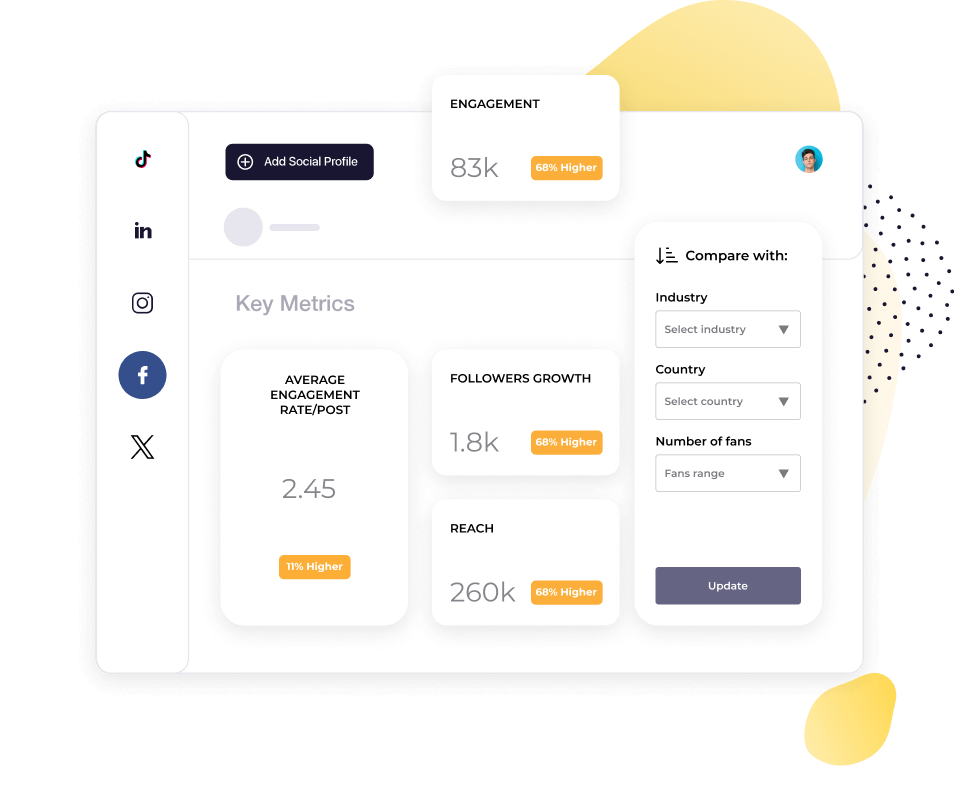
여러 Facebook 페이지를 한 번에 비교하세요
추적하려는 모든 경쟁사를 추가하고, 하나의 통합된 화면에서 모두 확인하세요.
페이지를 하나씩 확인하지 말고, 전체 경쟁사 집합의 인게이지먼트, 성장, 게시 빈도를 한눈에 비교하세요.
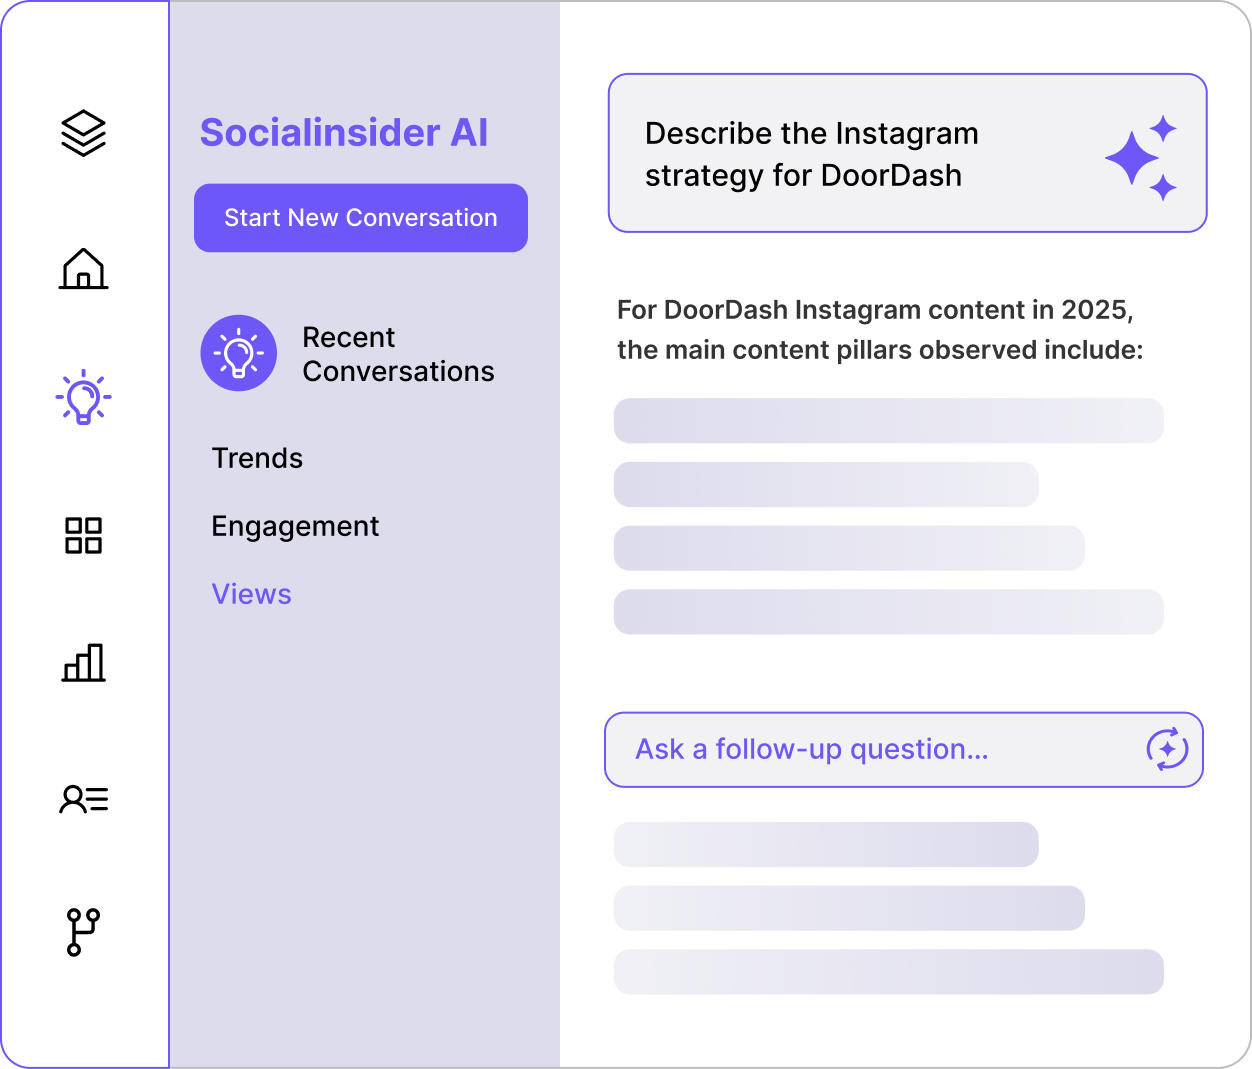
Socialinsider AI에게 무엇이든 물어보고 인사이트를 발견하세요
즉시 답을 얻을 수 있어 Facebook 경쟁사 분석이 쉬워집니다.
Socialinsider AI에게 쉬운 언어로 어떤 질문이든 하세요. 계정, 경쟁사 데이터, 시장 벤치마크를 실시간으로 분석합니다. '이번 달에 인게이지먼트가 왜 감소했나요?'와 같은 질문에도 몇 초 만에 답변을 받으세요.

"경쟁사 분석을 통해 시장에서 우리 성과를 명확하게 파악할 수 있었습니다."
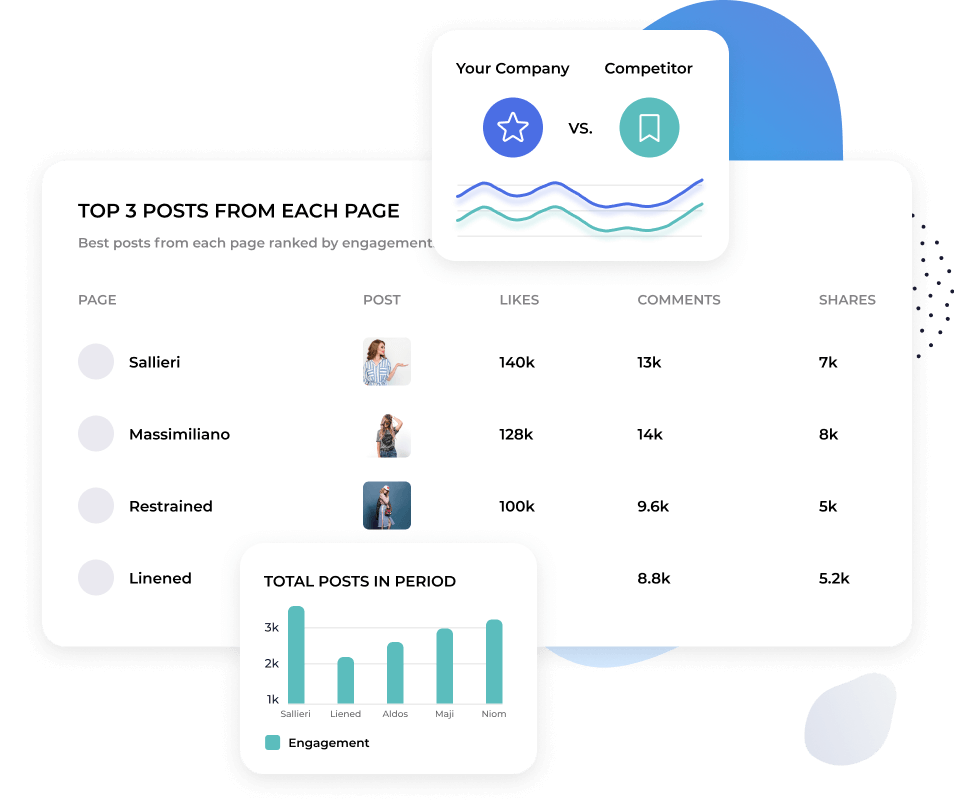
Know if there’s a shift in your market
When your engagement drops, the first question is whether it's happening to everyone or just you.
Socialinsider shows your trends alongside your competitors' trends so you can tell the difference immediately instead of making a best guess.
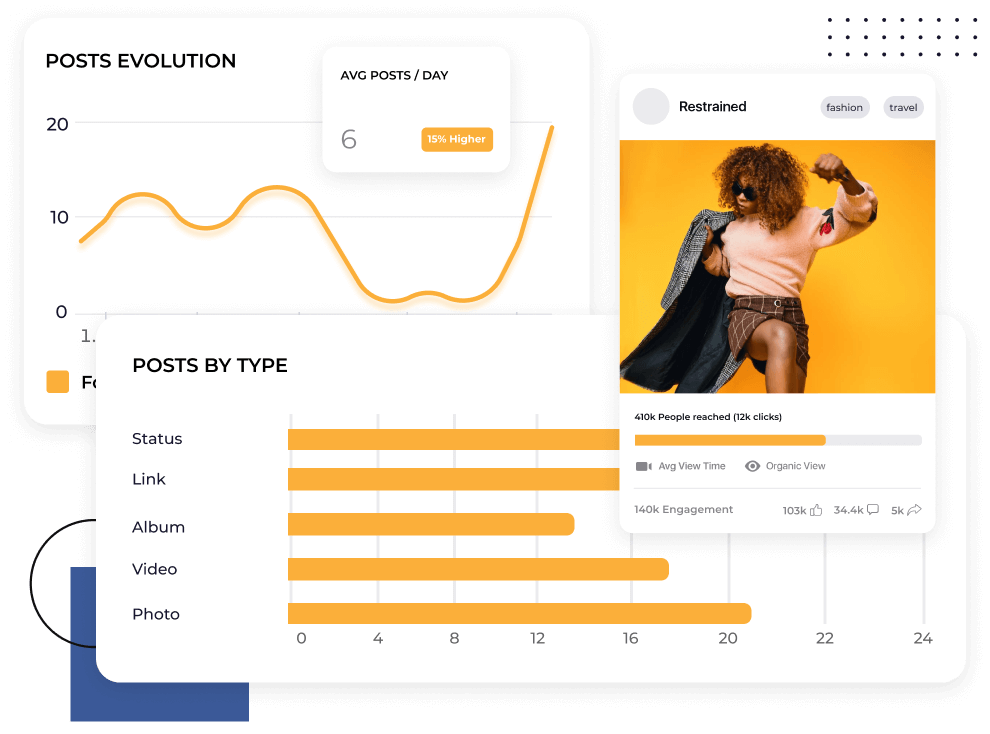
Find out what content is working on Facebook right now
What worked with Facebook's algorithm a year ago may not work today.
Socialinsider finds what types of content are performing well in your market so you can see patterns and post what gets likes, comments, and shares.
고객들이 저희에 대해 말하는 것
"고객 서비스도 제가 가장 좋아하는 기능 중 하나였습니다. 여러분은 정말 탁월합니다. 팀 전체가 매우 신속하게 대응해주고, 친절하며 도움이 됩니다. 이런 경험은 흔하지 않습니다."

"Socialinsider helped us understand whether we're improving or decreasing especially compared to the other accounts that we follow."

"Socialinsider는 경쟁사 분석을 통해 시장 대비 성과 인사이트를 제공합니다."

"감정 분석이 인스타그램 해시태그에 정말 뛰어납니다. 이 새로운 소셜 미디어 리스닝 대시보드는 장기적인 계획에 큰 도움이 되었습니다."

"We are using this social media analytics dashboard for all our 40 social media clients. We can have all the performance data in one single place."

"With Socialinsider, our team became more efficient. We do not need to spend time on social media data gathering. Instead, we can focus on insights and analysis."

"We use Socialinsider for day-to-day social media insights if we need to outline any simple strategic changes or review the performance of certain social posts."

"평균적으로 브랜드의 소셜 미디어 보고서를 Socialinsider에서 작성하면 1~2시간이면 충분합니다. 이전에는 데이터를 수집하는 데 하루가 걸렸습니다."

"Socialinsider 덕분에 연간 1만 6천 달러 이상을 절감했습니다. 월간 보고서와 복잡한 장기 분석에 드는 시간을 절약할 수 있었습니다."

Socialinsider에서 Facebook 인게이지먼트 비율 추적 방법
Socialinsider의 소셜 미디어 분석과 경쟁사 분석 도구로 소셜 미디어 성과를 측정하고, 감사하며, 성과를 비교할 수 있습니다.
Socialinsider에서 체험 계정을 만드세요
Add your competitors and connect the profiles you manage
Get all the engagement metrics for any Facebook business account
Compare your performance against your top competitors
Perform a cross-channel analysis to evaluate your Facebook performance.

경쟁력 있는 인사이트를 얻고
소셜 미디어 분석 지표를 탐색하세요
자주 묻는 질문
궁금한 점이 있으신가요? 저희가 답변해드립니다.
Facebook 분석이란 무엇입니까?
Facebook 분석은 Facebook 비즈니스 페이지에서 데이터와 지표를 수집하고 분석하는 것을 의미합니다. 이를 통해 소셜 미디어 마케팅의 효과를 측정할 수 있습니다.
Meta Business Suite, Facebook 인사이트, 그리고 Socialinsider와 같은 서드파티 앱 등 다양한 도구를 활용하여 분석 데이터를 확인할 수 있습니다. 이를 통해 오디언스 성장 및 행동, 콘텐츠와 캠페인 성과, 전체 마케팅 효과에 대한 인사이트를 얻을 수 있습니다.
Why are Facebook analytics important?
Facebook analytics are important because they help businesses and marketers to understand how their page, content and campaigns are performing.
A Facebook analytics dashboard gives you an overview and granular detail on audience demographics, engagement rates, ad spend, conversion metrics, and more. Using these insights, you can make informed decisions to optimize your strategy, improve your targeting and ultimately drive better results for your business.
Analytics reporting is especially important on Facebook, since it has the most users (over 3 billion) and therefore data of any social media platform. This holds huge potential for businesses, as long as you can organize and accurately assess all of that data.
Effectively leveraging Facebook data analysis will help you figure out:
- Who to target
- What content to create
- When, where and how to post (best times to post, post types and formats)
- Why tactics and strategies do or don’t work
…so you can make the most of that potential.
What’s the difference between Facebook analytics vs Facebook Insights?
Facebook analytics is a broad term used to describe the tracking and analysis of data and metrics from a Facebook page. Not to be confused with Facebook Analytics (capital “A”), which was the name of the platform’s native analytics app, retired in 2021.
In its place, you can now access Facebook analytics data through:
Facebook InsightsFacebook Insights is a reporting tool in the native app that offers detailed analytics of micro-level data.
Meta Business SuiteFacebook business analytics software that aggregates macro-level data from your Facebook and Instagram business profiles.
Third-party toolsPremium social media analytics tools like Socialinsider offer in-depth Facebook analysis in professional dashboards, with advanced metrics and automated reporting.
What are the top 3 Facebook analytics tools?
Wondering how to access analytics for Facebook? Facebook analytics software helps you monitor and understand metrics and data—but there are lots of tools to choose from.
To save you some time, here are the best reporting tools and what they offer:
Facebook Insights
A native tool by Meta, which you can access within the app.
Facebook Insights gives you comprehensive data about your page and recent posts, so you can see how your audience is growing and how your content is performing.
Insights tells you your reach, likes, comments, shares, audience demographics, competitor pages to watch and more, which will help you understand and build your presence.
Meta Business Suite
Meta Business Suite is another native tool for marketing professionals, which consolidates Instagram and Facebook business analytics in one place.
You can manage and report on multiple Facebook pages and Instagram accounts, with more in-depth metrics on post performance, audience insights and advertising data. This streamlines cross-platform management and gives you a holistic overview of your social media marketing efforts.
Socialinsider
Socialinsider is a third-party, robust social media analytics tool that provides advanced insights on your Facebook marketing.
It allows you to track your Facebook page performance in an in-depth, professional-level dashboard. You can compare and analyze any page to run a Facebook competitor analysis report or conduct cross–platform analysis. Then easily export all of this data in multiple formats whenever you want to audit or share results from your Facebook marketing.
All of which will help you optimize your strategy and stay ahead of the competition.
How to access Facebook analytics
Here are 3 ways where you can acces Facebook analytics insights
How to access analytics with Facebook Insights
To access analytics within Facebook Insights, follow these steps:
- Log into your Facebook account.
- Go to your business or fan page.
- Click on “Insights” in the top menu.
You’ll be able to see different metrics under these categories:
- Page overview: this is where you’ll find a summary of your Facebook page views, page likes and impressions, as well as total post reach and engagement.
- Audience: check Facebook followers and changes over time, plus audience demographics like language, age, gender and location.
- Recent posts: see reach, clicks, reactions, comments, shares and video views.
How to access Facebook analytics in the Meta Business Suite
To see insights in the Meta Business Suite, follow these steps:
- Log into your Facebook account.
- Navigate to the Meta Business Suite: business.facebook.com.
- Select your business account.
- Click on “Insights” in the left-hand menu.
You’ll get more sophisticated data aggregation and macro metrics that aren’t available in Page Insights:
- Overview metrics: reach (both paid and organic), 3-second views, 1-minute views, minutes viewed, content interactions, reach breakdown.
- Comparison between Facebook and Instagram performance: reach, visits, net followers.
- Existing vs potential audience: demographics and metrics on your current audience, as well as potential users you could target.
- Benchmarking: industry insights and Facebook competitive analysis.
- Content overview: all post formats (Reels, videos, Live, posts, Stories), top content formats and audience retention.
How to access Facebook analytics with Socialinsider
Socialinsider is a robust Facebook analytics tool that lets you monitor your content performance, profile growth and insights in one place.
To access Facebook analytics with Socialinsider, follow these steps:
- Sign up or log in to your account on socialinsider.io.
- Create a new project or navigate to an existing project. Click “Connect social accounts”.
- Connect to your Facebook account, then select the page(s) you would like to add.
- From your dashboard, you can select the page you wish to analyze.
You’ll get a comprehensive page Summary, where you can select the KPIs and charts you wish to see, depending on your most important metrics. For more detailed analysis, toggle between engagement, reach, impressions, audience, and more.
Here are some examples of the analytics you get with Socialinsider:
- History post data
- Top Facebook analytics metrics: content, engagement, estimated reach (only Facebook provides accurate reach metrics—we estimate this metric based on other data), impressions, audience demographics, top posts, video metrics
- Social media competitor analysis: industry-wide and direct competitors
- Top-performing content formats
- Reels analytics
- Video analytics
- Cross-channel analysis: compare your Facebook page performance with your Instagram performance
You can export or schedule a Facebook analytics report with all the data you want to see.
어떤 Facebook 페이지 분석 지표를 추적해야 할까요?
Facebook 데이터 리포팅은 소셜 미디어 마케팅 전략의 효과에 대한 중요한 인사이트를 제공합니다.
하지만 Facebook 지표의 종류가 너무 많아 압도될 수 있습니다. 각각의 의미는 무엇일까요? 어떤 지표를 추적해야 할까요? 그리고 그 데이터를 활용해 비즈니스 성공을 이끌 방법은 무엇일까요?
알아야 할 핵심 내용을 정리했습니다.
Facebook 데이터 분석 방법
Facebook 페이지 분석을 처음 시작한다면, 비즈니스에 중요한 것이 무엇인지 먼저 고려하세요.
페이지가 브랜드 인지도를 높이는 상위 퍼널 채널이라면? 유기적 게시물이 널리 퍼져 더 많은 사람에게 리치된다면 이상적입니다. 이 경우 리치, 임프레션, 팔로워/팬 증가, 인게이지먼트에 우선순위를 두어야 합니다.
혹은 Facebook이 매출로 이어지는 핵심 유입 채널이라면? Facebook 광고 분석을 자세히 점검해 최고의 ROI를 확보해야 합니다.
이처럼 목표를 먼저 설정하면 Facebook 분석의 깊은 통찰을 제대로 활용할 수 있습니다. 그러면 어떤 지표가 성과를 보여주는지 명확해집니다.
Facebook 지표는 다음과 같이 분류할 수 있습니다.
- 페이지 분석
- 오디언스 인사이트
- 게시물 분석
- 스토리 분석
- 릴스 분석
- 비디오 분석
- 라이브 분석
- 광고 분석
각 카테고리를 자세히 살펴보겠습니다.
어떤 Facebook 페이지 분석 지표를 추적해야 할까요?
Facebook 비즈니스 페이지 분석은 페이지 성과 전반을 다룹니다. 리치, 임프레션, 인게이지먼트, 클릭, 멘션, 팔로워 등이 포함됩니다.
이 인사이트는 사용자가 페이지와 콘텐츠에 어떻게 반응하는지 알려줍니다. 게시물과 활동의 영향을 파악할 수 있습니다.
Facebook 페이지 분석을 추적하는 이유는, 콘텐츠 제작에 많은 노력이 들어가기 때문입니다. 개별 게시물 성과만 신경 쓸 수 있지만, 전체적인 전략을 위해 큰 그림을 봐야 합니다.
페이지 지표는 브랜드 전체 존재감의 리트머스지와 같습니다. 게시물과 활동이 브랜드 인지도를 키우고, 오디언스를 인게이지하며, 트래픽을 유입하는 피드백 루프가 됩니다.
리치 - Socialinsider에서 추정치로 제공리치는 페이지나 관련 콘텐츠를 본 고유 계정(개별 사용자)의 수입니다.
리치 데이터는 Meta 및 Socialinsider에서 추정치로 확인할 수 있습니다.
임프레션 - Socialinsider에서 제공임프레션은 페이지나 관련 콘텐츠가 사용자의 피드에 보여진 총 횟수입니다.
인게이지먼트 - Socialinsider에서 제공인게이지먼트는 콘텐츠에 대한 사용자 상호작용(좋아요, 댓글, 공유)의 총합입니다.
게시물별 인게이지먼트율(리치/팔로워 기준) - Socialinsider에서 제공인게이지먼트 비율은 콘텐츠에 반응한 사람(인게이지먼트 수)을 콘텐츠를 본 사람(리치) 또는 볼 수 있는 전체 인원(팔로워)으로 나눈 백분율입니다.
링크 클릭수 - Socialinsider에서 제공링크 클릭수는 게시물 내 링크가 클릭된 횟수입니다.
멘션 - Socialinsider에서 제공멘션은 다른 페이지나 사용자가 내 페이지를 게시물에서 언급한 횟수입니다.
인게이지먼트별 게시물 유형 - Socialinsider에서 제공인게이지먼트별 게시물 유형은 어떤 콘텐츠(텍스트, 사진, 비디오 등)가 인게이지먼트(좋아요, 댓글, 공유)를 가장 많이 받는지 보여줍니다.
팔로워 - Socialinsider에서 제공팔로워는 내 페이지를 좋아요 또는 팔로우한 사용자 수의 총합입니다.
팔로워 증감률 - Socialinsider에서 제공팔로워 증감률은 특정 기간(주간, 월간, 연간 또는 사용자 정의)에 페이지 팔로워가 얼마나 성장했는지 보여줍니다.
어떤 Facebook 오디언스 지표를 추적해야 할까요?
Facebook 오디언스 인사이트 지표는 오디언스의 연령, 성별, 지역, 언어와 같은 인구통계, 행동, 선호를 파악할 수 있게 해줍니다. 맞춤형 콘텐츠 제작에 활용하세요.
소셜 미디어 페르소나를 아는 것은 모든 성공적인 소셜 미디어 마케팅 플랜의 기본입니다. 이 정보를 활용해 콘텐츠와 활동을 최적화하면, 적합한 대상에게 리치 및 인게이지먼트를 극대화할 수 있습니다. 예로, 지역별 Facebook 그룹 시작, 특정 국가/지역 인플루언서 협업 등이 있습니다.
오디언스 인사이트는 잠재 오디언스 데이터까지 제공합니다. 기존 팔로워뿐 아니라 내 페이지에 관심이 있을 수 있는 더 넓은 사용자 집단을 모니터링해 브랜드 커뮤니티를 지속적으로 키운다 할 수 있습니다.
연령/성별 - Socialinsider에서 제공팔로워를 연령대와 성별별로 분류한 인구통계 데이터입니다.
위치 - Socialinsider에서 제공오디언스의 지역 분포로, 팔로워가 많은 상위 도시와 국가를 보여줍니다.
언어 - Socialinsider에서 제공오디언스가 사용하는 주요 언어입니다.
잠재 오디언스 - Meta에서 추적타겟팅 조건에 부합해 콘텐츠나 광고를 통해 리치될 수 있는 추정 사용자 수입니다.
어떤 Facebook 게시물 분석 지표를 추적해야 할까요?
게시물 분석은 개별 게시물별 지표를 제공합니다. 임프레션, 리치, 링크 클릭, 인게이지먼트, 인게이지먼트 비율, 비디오/릴스 재생수, 상위/하위 게시물, 게시물 주제 및 카테고리 인사이트 등이 있습니다.
성과가 가장 좋은 게시물과 가장 낮은 게시물을 모두 추적하면 반복되는 테마를 찾을 수 있습니다. 잘되는 것은 더 많이, 안 되는 것은 줄이세요.
게시물 임프레션 - Socialinsider에서 제공특정 게시물이 사용자에게 보여진 총 횟수입니다.
게시물 리치 - Socialinsider에서 제공특정 게시물을 본 고유 사용자 수입니다.
게시물 링크 클릭 - Socialinsider에서 제공특정 게시물 내 링크가 클릭된 횟수입니다.
인게이지먼트 - Socialinsider에서 제공특정 게시물에 대한 모든 상호작용(좋아요, 댓글, 공유)입니다.
게시물별 인게이지먼트율(게시물 리치 기준) - Socialinsider에서 제공해당 게시물에 대한 인게이지먼트(좋아요, 댓글, 공유) 비율로, 이를 게시물을 본 사용자 수에 대해 산출합니다.
비디오/릴스 재생수 - Socialinsider에서 제공사용자가 내 비디오 또는 릴스를 재생·조회한 총 횟수입니다.
상위 게시물 - Socialinsider에서 제공가장 많은 인게이지먼트, 인게이지먼트율, 리치 또는 주요 지표를 기록한 게시물입니다.
하위 게시물 - Socialinsider에서 제공인게이지먼트, 인게이지먼트율, 리치 또는 주요 지표가 가장 낮은 게시물입니다.
게시물 그룹 - Socialinsider에서 제공콘텐츠 주제, 게시물 형식, 인게이지먼트 유형(예: 다양한 반응), 기타 카테고리로 태깅 및 그룹화된 게시물의 고급 데이터 분석입니다.
어떤 Facebook 스토리 분석 지표를 추적해야 할까요?
스토리 분석은 스토리의 리치와 인게이지먼트를 보여줍니다.
스토리는 24시간만 노출되는 영상, 이미지, 텍스트 등 일회성 콘텐츠입니다. 게시물 사이사이에 즉각적으로 오디언스를 인게이지할 수 있는 강력한 방식입니다.
비즈니스 페이지는 스토리를 활용해 브랜드 인지도와 인게이지먼트를 높일 수 있습니다. 스토리가 화면 상단에 강하게 노출되므로, 오디언스가 브랜드와 더 자주 상호작용하게 합니다. 상시 소통과 빠른 피드백이 가능합니다.
또한 스토리는 사진이나 동영상 게시물 대비 저렴하게 콘텐츠를 제작할 수 있는 방법입니다. 그래도 높은 가치를 가지므로 스토리 분석을 반드시 모니터링해야 합니다.
스토리 리치 - Meta에서 추적내 스토리를 조회한 고유 사용자 수입니다.
스토리 상호작용스토리에서 발생한 모든 상호작용(터치, 스와이프, 답장, 반응)의 총합입니다.
어떤 Facebook 릴스 분석 지표를 추적해야 할까요?
릴스 분석은 비디오 조회수, 리치, 인게이지먼트에 관한 인사이트를 제공합니다.
릴스는 3~90초의 세로(9:16) 포맷의 짧은 비디오입니다. 스토리보다 신경썼지만 비디오 게시물보다는 간단한, 몰입과 엔터테인먼트에 특화된 포맷입니다.
비디오 마케팅은 소셜 미디어에서 점점 중요해지며, Facebook도 예외가 아닙니다. 릴스는 알고리즘 상 우선 노출되며, 팔로워가 아닌 사용자에게도 리치됩니다. 그래서 브랜드 발견 및 리치 확대에 효과적입니다.
릴스는 트렌드와 창의성이 돋보입니다. 적은 예산으로도 강력한 마케팅 효과를 낼 수 있습니다. 잘 만든 릴스로 바이럴 트렌드를 따라가거나, 제품·서비스를 직접 홍보할 수 있습니다.
릴스의 잠재력을 극대화하고 빠르게 변화하는 트렌드에 대응하려면 릴스 분석을 긴밀히 모니터링해야 합니다.
이들 지표는 일반 게시물 분석과 유사하지만, 그 중 초기 재생수, 시청 분 등은 릴스만의 특성을 반영해 더 자세합니다.
초기 재생수 - Meta에서 추적사용자가 해당 릴스를 처음 재생한 횟수입니다.
시청 분 - Meta에서 추적사용자가 릴스를 시청한 전체 시간(분)입니다.
상호작용 - Socialinsider에서 제공릴스에 대한 모든 사용자 상호작용(좋아요, 댓글, 공유)입니다.
게시물 리치 - Socialinsider에서 제공특정 릴스를 조회한 고유 사용자 수입니다.
게시물 링크 클릭 - Socialinsider에서 제공특정 릴스 내 링크 클릭 총횟수입니다.
인게이지먼트 - Socialinsider에서 제공특정 릴스에서 발생한 상호작용(좋아요, 댓글, 공유) 총합입니다.
게시물별 인게이지먼트율 - Socialinsider에서 제공해당 릴스를 본 사용자 수 대비 인게이지먼트(좋아요, 댓글, 공유) 비율입니다.
어떤 Facebook 비디오 분석 지표를 추적해야 할까요?
비디오 분석은 비디오 게시물의 조회수, 리치, 인게이지먼트 현황을 보여줍니다.
릴스와 마찬가지로, 비디오 게시물은 알고리즘 상 우선 노출되어 정적 게시물에 비해 넓은 리치와 높은 인게이지먼트를 기록합니다.
릴스와 Facebook 비디오의 차이는, 릴스는 별도 피드가 있어 비팔로워에게도 확산됩니다. 콘텐츠 형식도 비디오가 더 길고 트렌드성이 상대적으로 낮습니다.
이에 따라 장기 비디오 게시물은 복잡한 메시지 전달, 시청자 관심 유지, 브랜드 성격 구축에 효과적입니다. 예를 들어, 창업자 스토리 소개, 제품 활용법 시연 등에 활용할 수 있습니다.
장기 비디오 게시물은 스토리 또는 릴스보다 시간, 리소스, 예산이 많이 소요됩니다. 비디오 분석을 통해 투자 대비 최대 효과를 확인하세요.
시청 분 - Meta에서 추적Facebook에서 특정 비디오를 사용자가 시청한 전체 시간(재생 포함)입니다.
인게이지먼트 - Socialinsider에서 제공비디오에 대한 인게이지먼트(좋아요, 댓글, 공유, 반응)의 총합입니다.
게시물 임프레션 - Socialinsider에서 제공특정 비디오가 사용자의 피드에 노출된 전체 횟수(상호작용 여부 무관)입니다.
게시물 리치 - Socialinsider에서 제공특정 비디오 게시물을 본 고유 사용자 수입니다.
게시물 링크 클릭 - Socialinsider에서 제공특정 비디오 게시물 내 링크가 클릭된 총 횟수입니다.비디오 게시물별 인게이지먼트율 - Socialinsider에서 제공비디오를 본 사용자 수 대비 인게이지먼트(좋아요, 댓글, 공유) 비율입니다.
어떤 Facebook 라이브 분석 지표를 추적해야 할까요?
Facebook 라이브 분석은 라이브 방송의 성과 데이터를 제공합니다.
라이브 기능을 통해 비즈니스 페이지는 실시간으로 오디언스와 소통할 수 있습니다. 라이브 방송을 진행하면 즉각적인 피드백을 받고, 이상적인 고객과 진정성 있는 관계를 구축합니다.
라이브 포맷은 투명성을 높이고 신뢰를 구축합니다. 신제품 런칭, Q&A, AMA, 행사 생중계, 비즈니스 비하인드 공유에 이상적입니다.
또한, Facebook 라이브는 알고리즘 상 노출 우위가 있어 리치/인게이지먼트 상승에 효과적입니다. 라이브 분석을 통해 가장 효과적이고 흥미로운 오디언스 소통 방식을 결정할 수 있습니다.
시청 분 - Meta에서 추적사용자가 Facebook 라이브를 시청한 전체 시간(분)입니다.
인게이지먼트 - Socialinsider에서 제공라이브 방송 중 발생한 인게이지먼트(좋아요, 댓글, 공유, 반응) 총합입니다.
동시 시청자(최고 시청 수) - Socialinsider에서 제공동일 시간(최소 3초) 동안 동시에 방송을 시청한 최대 시청자 수입니다.
어떤 Facebook 광고 분석 지표를 추적해야 할까요?
광고 분석은 광고 캠페인 성과를 보여줍니다. 이를 통해 광고 예산을 최적화하고 ROI를 극대화할 수 있습니다.
비즈니스는 효과적인 Facebook 마케팅 전략 수립을 위해 많은 시간, 리소스, 예산을 투자합니다. 추적과 보고가 필수입니다. 광고는 특히 더 큰 투자가 필요하기 때문입니다.
광고 분석 모니터링을 위한 최적의 도구는 Meta Ads Manager입니다. 리치, 임프레션, 결과당 비용 등 주요 지표 분석을 통해 이상적인 오디언스 파악, 비즈니스 목표 대비 광고 성과 추적, 데이터 기반 콘텐츠·캠페인 개선이 가능해집니다.
광고를 깊이 이해할수록 더 나은 결과를 얻을 수 있습니다.
리치 - Meta에서 추적내 Facebook 광고를 본 고유 사용자 수입니다.
임프레션 - Meta에서 추적Facebook 광고가 노출된 전체 횟수(클릭 여부 상관 없음)입니다.
결과당 비용 - Meta에서 추적Facebook 광고를 통해 발생한 원하는 결과 또는 행동(예: 클릭, 전환) 한 건당 평균 비용입니다. 예시: 광고비 $100, 클릭 10회라면 결과당 평균 비용은 $10입니다.
Facebook 분석 보고서 읽는 방법
Facebook에서는 엄청난 양의 데이터를 제공하므로, 마케팅 전략의 효과를 파악하는 데 큰 인사이트를 얻을 수 있습니다. 반면, 이 데이터를 어떻게 정리하고 분석해야 하는지 혼란스러울 수 있습니다.
그렇다면 Facebook 분석 보고서를 읽을 때 어디서부터 시작해야 할까요?
다음 핵심 항목을 확인하세요:
성과 추적: 핵심 지표
Facebook 분석의 존재 이유는 페이지와 콘텐츠의 성과 파악에 있습니다. 먼저, 비즈니스 목표와 가장 관련 깊은 KPI에 집중하세요. 보통 다음과 같은 지표가 해당됩니다:
- 리치
- 임프레션
- 인게이지먼트
- 전환율
이 지표를 장기간 추적하면, 전략의 성공여부를 판단할 수 있는 트렌드와 패턴을 발견할 수 있습니다.
오디언스 인구통계
다음으로 주목할 데이터는 오디언스 인구통계입니다. 내 콘텐츠가 누구에게 리치되고 인게이지먼트가 발생하는지, 그 대상이 정말 적합한지 파악하는 데 중요합니다.
연령, 성별, 지역, 관심사 등 다양한 요소가 포함됩니다. 이 인사이트를 따르면 타겟 오디언스에 맞춰 메시지와 전략을 조정할 기회를 찾을 수 있습니다. 콘텐츠, 캠페인, 기타 활동의 적합성과 타겟팅 정확도가 높아집니다.
또한, 새로운 지역으로 확장하는 등 전략 진화 가능성을 확인할 수도 있습니다.
콘텐츠 최적화
Facebook 분석은 콘텐츠 마케팅 효율화에 핵심 역할을 합니다. 소셜 미디어 알고리즘은 빠르게 변화하므로, 오늘 효과 있던 포맷이 내일은 아닐 수 있습니다. 항상 세심하게 챙기세요.
정기적인 분석 및 리포팅을 통해 어떤 유형의 콘텐츠가 리치/인게이지먼트가 높은지 점검할 수 있습니다. 타겟 오디언스에 반응이 좋은 포맷을 파악해, 성공 사례는 반복하고 성과 없는 포맷은 중단하세요.
신규 트렌드 참여 여부, 전략 조정도 판단할 수 있습니다.
예시로, 릴스가 리치를 높이거나 유머러스한 콘텐츠가 팔로워 증가에 효과적인지 확인할 수 있습니다. 이런 인사이트를 활용하면 방향성 있게 콘텐츠를 제작할 수 있습니다.
예산 배분
비즈니스 콘텐츠를 제작한 경험이 있다면, 시간·전문성·예산이 필요하다는 사실을 잘 아실 겁니다. 투자에 대한 성과를 시각적으로 명확하게 보여주고 설명해야 합니다.
Facebook 분석은 예산이 적절히 사용되고 올바른 결과로 이어지는지 평가할 수 있도록 돕습니다. 클릭당 비용, 전환당 비용 등의 지표로 ROI를 확인하고, 이를 이해관계자와 공유해 마케팅 효과를 입증하세요.
이후에는 효과가 가장 좋은 광고나 캠페인 중심으로 예산을 재배분하면 됩니다.
전략 조정
Facebook 분석은 다양한 데이터로 세부 전술을 진단할 수 있습니다. 타겟 오디언스 설정, 트렌드형 콘텐츠, 광고 집행 등 분야를 막론합니다.
이 모든 데이터를 통합 분석하면 전체 전략의 큰 그림이 보입니다. 궁극적으로 비즈니스 목표 달성을 위한 계획·방법론을 점검하게 됩니다.
성과 추적, 오디언스 인구통계, 콘텐츠 최적화, 예산 배분에서 얻은 인사이트를 결합하면 전략이 제대로 작동하는지 답을 얻을 수 있습니다. 예를 들어, 내 전술이 브랜드 인지도 구축이나 매출 증대에 어떻게 기여하는지 평가할 수 있습니다.
이후에는 변화가 필요한 부분과 유지할 부분을 결정할 수 있습니다. Facebook 리포팅을 통해 주요 인사이트·결과를 팀에 공유하세요. 데이터 기반 의사결정으로 콘텐츠, 타겟팅, 캠페인 방향성을 개선하세요.
페이스북에서 게시물 분석 확인 방법
페이스북 게시물 분석은 기업이 성과를 즉각적이고 쉽게 파악할 수 있는 가장 기본적인 방법 중 하나입니다. 게시물 데이터를 매주, 더 나아가 매일 확인하고 싶으실 겁니다. 아래 방법을 따라 해보세요.
#1. Facebook 페이지 인사이트에서
페이지 인사이트에서 게시물 분석을 확인하려면 다음 단계를 따라주세요.
- 페이스북 계정에 로그인합니다. 피드에서 "Professional Dashboard"를 클릭하거나 관리 중인 페이지로 이동해 "Manage"를 클릭하세요.
- Professional Dashboard에 들어가면 "Your Page"로 이동해 게시물 리치와 인게이지먼트 개요를 볼 수 있습니다.
- 혹은 "Content" 섹션으로 이동해 더 자세한 분석을 확인할 수도 있습니다.
#2. Meta Business Suite에서
Meta Business Suite는 게시물에 대한 더 세분화된 데이터를 제공합니다. 인스타그램 콘텐츠와도 비교할 수 있습니다.
Meta Business Suite에서 페이스북 게시물 분석을 확인하려면 아래 단계를 따라 해보세요.
- 페이스북에 로그인하여 우측 상단 프로필 사진을 클릭합니다.
- "See all profiles"를 선택한 다음 분석하고 싶은 페이지를 선택하세요.
- 왼쪽 메뉴에서 Meta Business Suite로 이동합니다.
- "Insights"를 클릭하고 아래로 내려가 "Content"를 선택합니다.
- 상위 지표(예: 미디어 유형별 미디언 게시물 리치)는 "Overview"에서, 게시물별 세부 지표(예: 게시물 리치, 반응, 댓글, 공유)는 "Content"에서 확인하세요.
#3. Socialinsider에서
Socialinsider는 더욱 고급 페이스북 분석을 제공해 더 전문적이고 세밀하게 성과를 이해할 수 있습니다.
Socialinsider에서 페이스북 게시물 분석을 확인하려면 아래 과정을 따르세요.
- Socialinsider 계정에 가입하거나 로그인하세요.
- 프로젝트를 선택 또는 생성하고 분석할 페이스북 페이지를 선택하거나 연결하세요.
- 왼쪽 사이드바의 다양한 섹션을 통해 원하는 데이터를 확인하세요. "Content"에서는 전체 게시 현황(예: 게시물 분포, 게시 시간, 상위/하위 게시물)을 볼 수 있습니다. "Posts"나 "Video"에서는 개별 게시물의 리치, 임프레션, 인게이지먼트, 조회수와 같은 더 세밀한 지표를 확인할 수 있습니다.
구글 분석에서 페이스북 트래픽 추적 방법
귀하의 페이스북 페이지가 브랜드 인지도, 리드 생성 또는 제품·서비스 확보 채널로 활용되고 있습니까? 그렇다면 페이스북 마케팅이 웹사이트 트래픽으로 어떻게 연결되는지 꼼꼼히 확인할 필요가 있습니다.
다음 단계를 따라 구글 분석(GA)에서 페이스북 페이지 유입 트래픽을 추적할 수 있습니다.
1. 구글 캠페인 URL 빌더로 UTM 파라미터 설정
먼저, 공유하려는 링크에 UTM 파라미터를 설정해야 합니다. 이를 통해 GA에서 페이스북 트래픽을 정확하게 추적할 수 있습니다.
구글 캠페인 URL 빌더로 웹사이트 링크에 UTM 파라미터를 추가하세요. 소스, 매체, 캠페인 이름, 용어, 콘텐츠 등 주요 정보를 입력하면 추적 가능합니다.
예시: utm_source=facebook, utm_medium=social, utm_campaign=[campaign_name]
2. 커스텀 URL을 게시물에 추가
위 항목들을 입력하면, 구글에서 추적 가능한 맞춤 URL을 만들어줍니다. 이 링크를 복사하여 페이스북 게시물에 붙여넣으세요.
링크를 더 짧게 만들고 싶다면 Bitly와 같은 도구를 사용할 수 있습니다.
3. 구글 분석에서 트래픽 측정
GA 계정에 로그인 후 Reporting > Acquisition > Traffic acquisition으로 이동하세요.
여기에서는 콘텐츠와 캠페인을 통해 유입된 트래픽을 볼 수 있습니다. 세션 수, 이탈률, 전환과 같은 지표도 확인 가능합니다.
드롭다운 메뉴에서 UTM 파라미터(세션 매체, 소스, 캠페인 등)별로 보기를 변경할 수 있습니다.
4. 성과 분석
GA는 페이스북 마케팅이 웹사이트 또는 랜딩 페이지에 어느 정도 트래픽을 유도하는지 보여줍니다. 이메일, 인스타그램 등 다른 채널과도 비교하세요. 이 인사이트를 활용해 보고서를 만들고 전략을 최적화하세요.
페이스북 분석 기능은 아직 사용할 수 있나요?
Facebook Analytics는 비즈니스 페이지와 프로필의 청중 및 성과 데이터를 추적하던 페이스북의 자체 도구 명칭이었습니다. 2021년 7월부로 해당 도구는 더 이상 제공되지 않습니다.
이제는 Facebook Page Insights, Meta Business Suite 또는 Socialinsider 같은 타사 도구에서 페이스북 분석(비즈니스 페이지 지표와 데이터를 의미)을 추적할 수 있습니다.
페이스북에서 데이터 분석은 어떻게 활용되나요?
페이스북은 전반적으로 데이터 분석을 통해 사용자 행동 및 캠페인 성과를 추적합니다.
Meta는 쿠키를 활용해 플랫폼 안팎에서 사용자 활동 데이터를 수집하고, 행동 정보를 저장합니다.
수집된 데이터는 콘텐츠를 개인화하고, 기능을 개선 및 신규 개발하며, 사용자 보호와 광고 타겟팅, 플랫폼 효율적 운영에 활용됩니다.
비즈니스 페이지 운영자도 Facebook의 인사이트, Meta Business Suite, Socialinsider와 같은 도구를 통해 이 데이터를 분석에 활용할 수 있습니다. 이런 도구들은 데이터를 집계·분석해, 주요 성과 지표 추적과 오디언스 인사이트 활용, 소셜 미디어 전략 최적화에 도움을 줍니다.
페이스북 분석 데이터 내보내기
맞춤형 페이스북 마케팅 보고서를 만들고 싶다면, Meta Business Suite 또는 타사 도구에서 페이스북 분석 데이터를 내보낼 수 있습니다.
Socialinsider에서는 페이스북 인사이트 데이터를 CSV, PPT, PDF, XLS 등 다양한 형식으로 내보낼 수 있습니다. 구글 Looker Studio에도 데이터를 임포트할 수 있습니다.
Socialinsider에서는 데이터 다운로드 예약 기능도 지원해, 페이스북 보고 자동화가 가능합니다. 브랜드 색상과 회사 로고를 추가해 페이스북 분석 보고서를 자유롭게 커스터마이즈하세요.