기본 인사이트를 넘어서는 LinkedIn 분석
Socialinsider는 사용이 쉬운 플랫폼에서 기업에게 LinkedIn 인게이지먼트와 성과에 대한 깊이 있는 인사이트를 제공합니다.
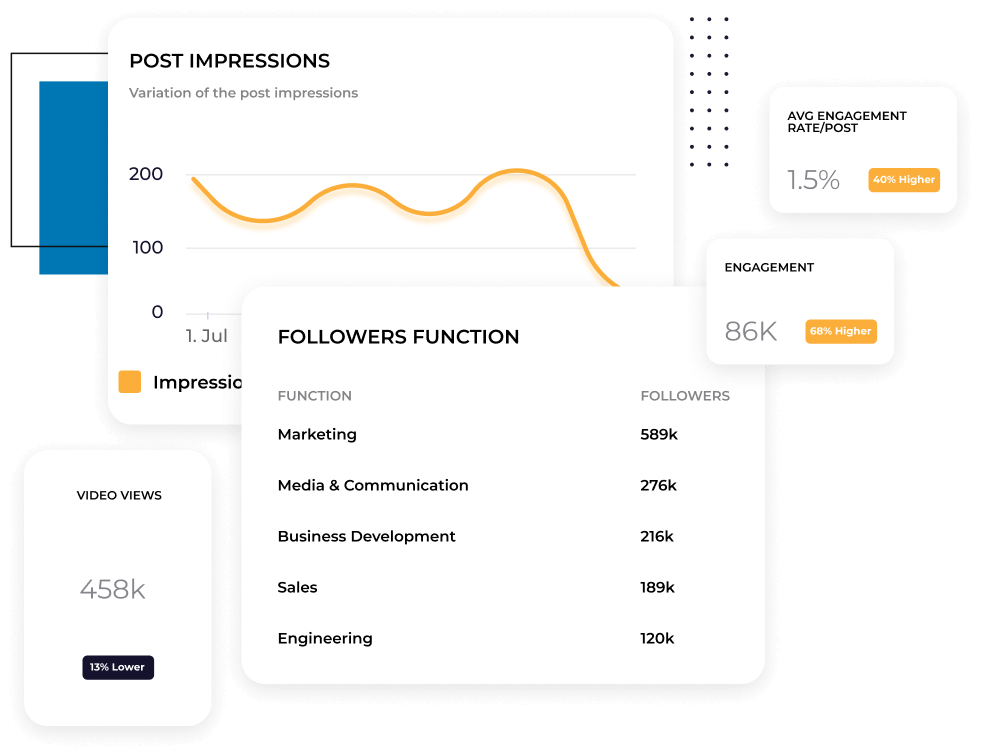


모든 LinkedIn 지표를 한 대시보드에서 확인하세요
하나의 화면에서 인게이지먼트, 임프레션, 클릭, 동영상 조회수, 팔로워 성장까지 모두 추적합니다. LinkedIn의 기본 분석이나 스프레드시트 사이를 번갈아볼 필요 없습니다. 매번 다시 만들지 않아도, 일/주/월 단위로 콘텐츠 성과를 한눈에 볼 수 있습니다.
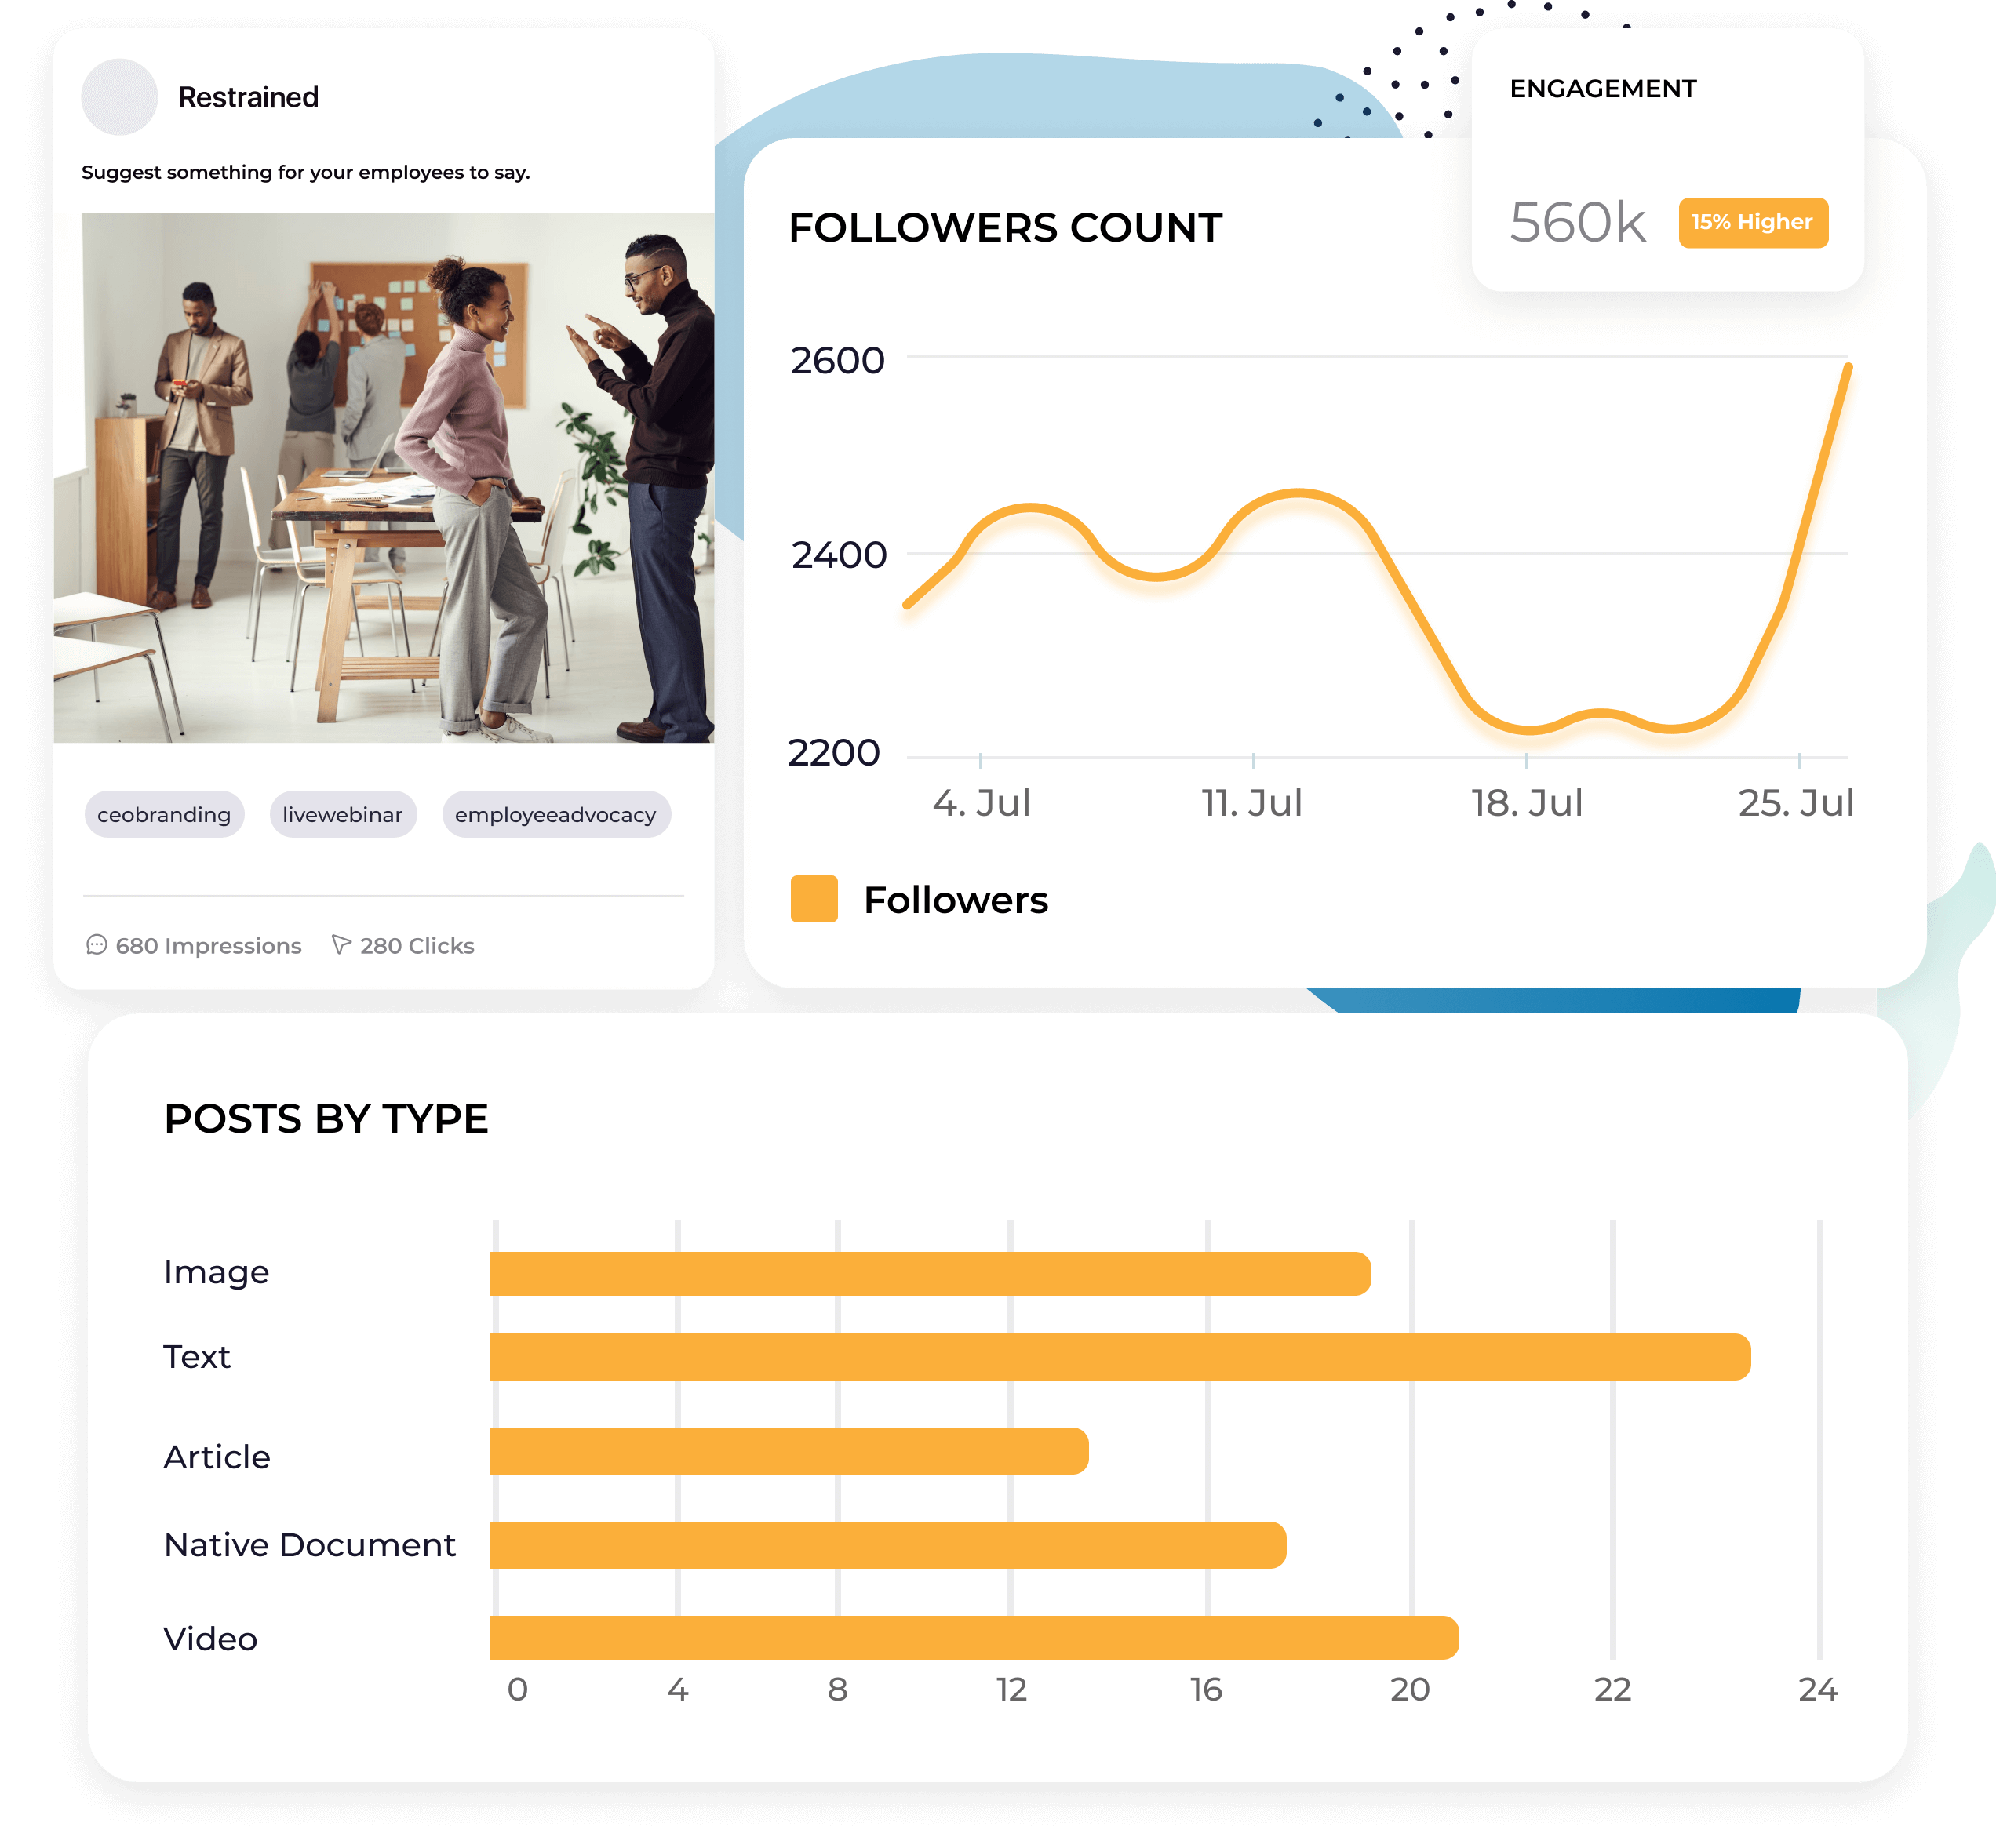
게시물별로 성과를 확인하세요
계정 단위의 지표는 평균만 보여줍니다. 게시물 단위 분석은 어떤 형식, 주제, 메시지 스타일이 더 많은 인게이지먼트를 유도하는지 알려줍니다. 전체 콘텐츠에서 성과 패턴을 찾아내어 효과적인 전략에 집중하세요.


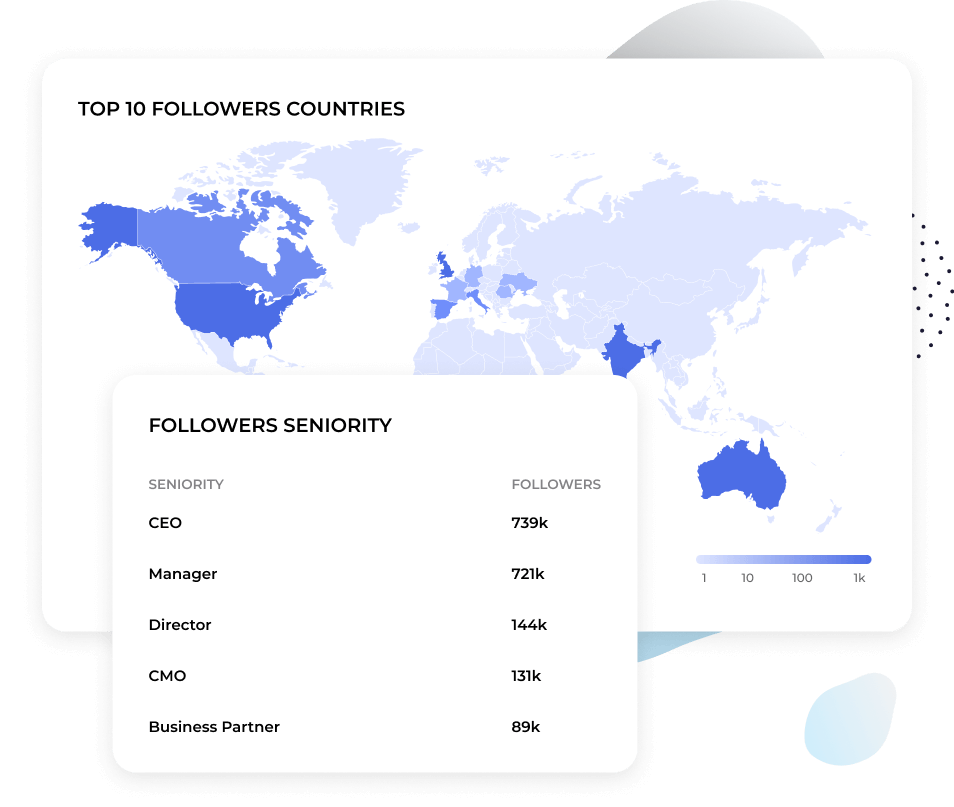
Know exactly who your content is reaching
TUnderstand audience attributes like job title, industry, and company size. See whether your content is landing with the decision-makers you're targeting or attracting the wrong crowd. Socialinsider gives you the level of detail you need to adjust.
Compare LinkedIn metrics to your other channels
See how LinkedIn stacks up against your other social platforms in one cross-channel view. Understand where engagement is strongest, where growth is happening fastest, and where you might be overinvesting or underinvesting.
고객들이 저희에 대해 말하는 것
"고객 서비스도 제가 가장 좋아하는 기능 중 하나였습니다. 여러분은 정말 탁월합니다. 팀 전체가 매우 신속하게 대응해주고, 친절하며 도움이 됩니다. 이런 경험은 흔하지 않습니다."

"Socialinsider helped us understand whether we're improving or decreasing especially compared to the other accounts that we follow."

"Socialinsider는 경쟁사 분석을 통해 시장 대비 성과 인사이트를 제공합니다."

"감정 분석이 인스타그램 해시태그에 정말 뛰어납니다. 이 새로운 소셜 미디어 리스닝 대시보드는 장기적인 계획에 큰 도움이 되었습니다."

"We are using this social media analytics dashboard for all our 40 social media clients. We can have all the performance data in one single place."

"With Socialinsider, our team became more efficient. We do not need to spend time on social media data gathering. Instead, we can focus on insights and analysis."

"We use Socialinsider for day-to-day social media insights if we need to outline any simple strategic changes or review the performance of certain social posts."

"평균적으로 브랜드의 소셜 미디어 보고서를 Socialinsider에서 작성하면 1~2시간이면 충분합니다. 이전에는 데이터를 수집하는 데 하루가 걸렸습니다."

"Socialinsider 덕분에 연간 1만 6천 달러 이상을 절감했습니다. 월간 보고서와 복잡한 장기 분석에 드는 시간을 절약할 수 있었습니다."

How to track LinkedIn engagement rate in Socialinsider
Socialinsider의 소셜 미디어 분석과 경쟁사 분석 도구로 소셜 미디어 성과를 측정하고, 감사하며, 성과를 비교할 수 있습니다.
Socialinsider에서 체험 계정을 만드세요
Connect the profiles you manage
Get all the engagement metrics for any LinkedIn business account
Analyze history posts data
Perform a cross-channel analysis to evaluate your LinkedIn performance.

경쟁력 있는 인사이트를 얻고
소셜 미디어 분석 지표를 탐색하세요
자주 묻는 질문
궁금한 점이 있으신가요? 저희가 답변해드립니다.
What are LinkedIn analytics?
LinkedIn analytics are data and insights that tell you how your LinkedIn company page is performing. Your LinkedIn analytics include metrics related to your audience, content, reach, ad campaigns, and more.
Some specific metrics you can expect to see from your LinkedIn analytics include:
- Page views: The number of times your company page was viewed
- Followers: The number of followers your page has
- Post impressions: The number of times your post was seen
- Reactions: The number of reactions (i.e., likes, supports, celebrations) your post has received
- Clicks: The number of clicks a link in your post has received
You can also track your growth and performance using graphs, enabling you to see if your follower count, post performance, and other KPIs are improving over time.
By paying attention to your LinkedIn analytics, you can make sure that your page is growing, your posts are resonating with your audience, and your LinkedIn marketing strategy is working.
Why track LinkedIn analytics?
So here’s the big question: Why bother tracking your LinkedIn analytics in the first place?
Why are they important?
What can they offer to your marketing team that could actually make a difference?
There are four major benefits your company can get from keeping track of your analytics on LinkedIn.
Get to know your target audience better
Your LinkedIn analytics give you access to data about your page visitors (people who have dropped by your company page) and your followers (people who actually follow your company page).
Some of that data includes:
- Location
- Industry
- Company size
- Job title
- Seniority
This helps you gain a better understanding of who your audience is—while also making sure you’re targeting the right people.
For example, if your target audience for your business’s product includes B2B founders and most of your followers are entry-level job holders, you’ll know you need to shift your messaging in order to attract a different audience.
Once you’re targeting the right social media personas, you can then use your audience demographic data to get a better understanding of who they are and use your post performance as a way to gauge what types of content resonate with them most.
This data gives you clear insight into exactly who your audience is and what they want to see from your business.
Improve your content strategy
Your LinkedIn company page analytics keep you up to date with your post performance. Things like reach, impressions, reactions, comments, shares, and the like. Paying attention to how many people are seeing and interacting with your content helps you get a better understanding of which types of posts resonate best with your audience.
There are a number of different types of posts you can create on LinkedIn. Some include:
- Text-only, informational posts
- Image posts
- Video posts
- PDF slideshow posts
Can you see any patterns in your LinkedIn post analytics? Which ones tend to reach a wider audience and generate more engagement?
By incorporating more of that type of content into your strategy, you should be able to continue your growth, improving your content strategy, and increasing your reach, engagement, and overall ROI on LinkedIn.
Generate a higher LinkedIn ROI
Finally, the biggest benefit and reason you should be tracking your LinkedIn analytics is that it helps you generate a higher ROI, or return on investment.
Look at it this way. If you don’t track metrics for organic and sponsored posts to see how they’re performing, you’ll have no idea if you’re getting the response you’re hoping for. And if you have no idea how your audience is responding, you’re just putting content out into the ether with no knowledge of whether it’s making people more interested in your business.
At the end of the day, the point of all of this LinkedIn marketing is to reach your target audience and convert them into paying customers. You need to have a thumb on your post performance if you hope to generate a positive ROI. And you need to adjust and adapt your strategy based on how your posts are performing if you want to improve your ROI even further.
How do you access LinkedIn analytics?
There are two main ways of getting LinkedIn analytics data for your company page, and we’re going to walk you through each one.
How to access your LinkedIn business page analytics via the native app
Firstly, LinkedIn offers its own built-in analytics for you to check out. These are basic stats that help give you a level one understanding of how your company page is doing.
To access your LinkedIn analytics directly on LinkedIn, head over to your company page and check out your Dashboard.
Your dashboard summary shows you details like:
- A few actionable insights
- Your recent posts
- Top key metrics like search appearance, page visitors, new followers, and impressions
- Trending employee posts
Your Analytics dashboard breaks up your LinkedIn page data into sections like:
- Content: Metrics that share the effectiveness of your posts
- Visitors: Demographics and sources of your page visitors
- Followers: Demographics and sources of your page followers
- Leads: Download leads you’ve collected from lead generation forms you’ve shared on LinkedIn to upload to your CRM
- Newsletters: If you have a LinkedIn newsletter, track performance (i.e., subscribers, views) here
- Competitors: Compare basic page details with your competitors
- Employee advocacy: Get insights into content recommended to employees
Many companies are satisfied with the level of analytics they receive from their LinkedIn pages. However, there’s another way to access even more analytics if you’re looking to dive even deeper.
How to access your LinkedIn analytics using a third-party analytics platform like Socialinsider
If you want to dive even deeper into your LinkedIn analytics, do so with the help of a third-party analytics platform. Socialinsider is the perfect solution.
Start by creating a Socialinsider account—if you haven’t done so already. Log in and connect your LinkedIn page so you can view your own data within the Socialinsider dashboard.
To do so, click Connect social accounts at the top of your home dashboard. You’ll then need to log in with your LinkedIn credentials so that you can get full social media analytics access inside Socialinsider.
The LinkedIn analytics you get using Socialinsider include:
- A summary report that you can customize by adding as many different metrics as you want. These will be available at a glance before diving into deeper reports.
- A content report that walks you through data like the number of posts you’ve shared in a given time period, your average posts/day, posts by type, top posts, and even the worst performing posts so you can find patterns.
- Engagement insights that showcase metrics like total engagements (i.e., likes, comments, shares) alongside KPIs like engagement rate (with or without clicks), average engagement, post types sorted by engagement, and more. You can even see the best day and time to post based on your average engagement. Plus, break down individual engagements, like comments, shares, clicks, and video views.
- Reach insights that share basic data on how many people you’ve reached with your LinkedIn content within a given time period.
- Impressions data that lets you see how many people have seen your content and find the best day and time to post based on your average impressions.
- An audience demographics report that lets you see analytics like follower count and growth, geographical distribution of your followers, and details about your followers at work.
- A section about your LinkedIn posts that give you a birds eye view of your recent posts in order of how well they performed, plus basic engagement metrics for each one.
- A head-to-head comparison dashboard that lets you analyze other company pages from a different region into your Socialinsider dashboard.
- Campaign reports based on posts you’ve tagged inside your Socialinsider account as being part of a specific campaign and their overall performance.
You can also download any and all of these LinkedIn analytics reports by clicking Download in the top right corner to share your LinkedIn page analytics with other team members. Formats available include CSV, PPT, PDF, and XLS. You can import LinkedIn data to Google’s Looker Studio, too.
Which LinkedIn page metrics do you need to track?
There are a number of LinkedIn metrics you should track in order to gain a full understanding of how your content is performing and if you need to make changes to your LinkedIn activity or overall strategy.
Finding the best LinkedIn content metrics to track helps you determine whether your strategy is working or not. There are different categories of analytics that help you understand different things, like how your content is performing, who your audience is, and more.
Those categories include:
- Content analytics
- Visitor analytics
- Follower analytics
- Lead analytics
- Newsletter analytics
- Competitor analytics
- Employee advocacy analytics
- LinkedIn traffic analytics
Let’s walk through the different LinkedIn profile analytics you might want to consider tracking, broken down by category.
Content analytics
LinkedIn content analytics refers to how your LinkedIn posts are doing—both individually and as a whole. Your overall LinkedIn marketing strategy relies heavily on your organic content performance, so there are a lot of metrics and KPIs to track here.
Luckily, Socialinsider can be a big help. Here are some of the most important LinkedIn metrics to track, all of which can be found right inside your Socialinsider dashboard.
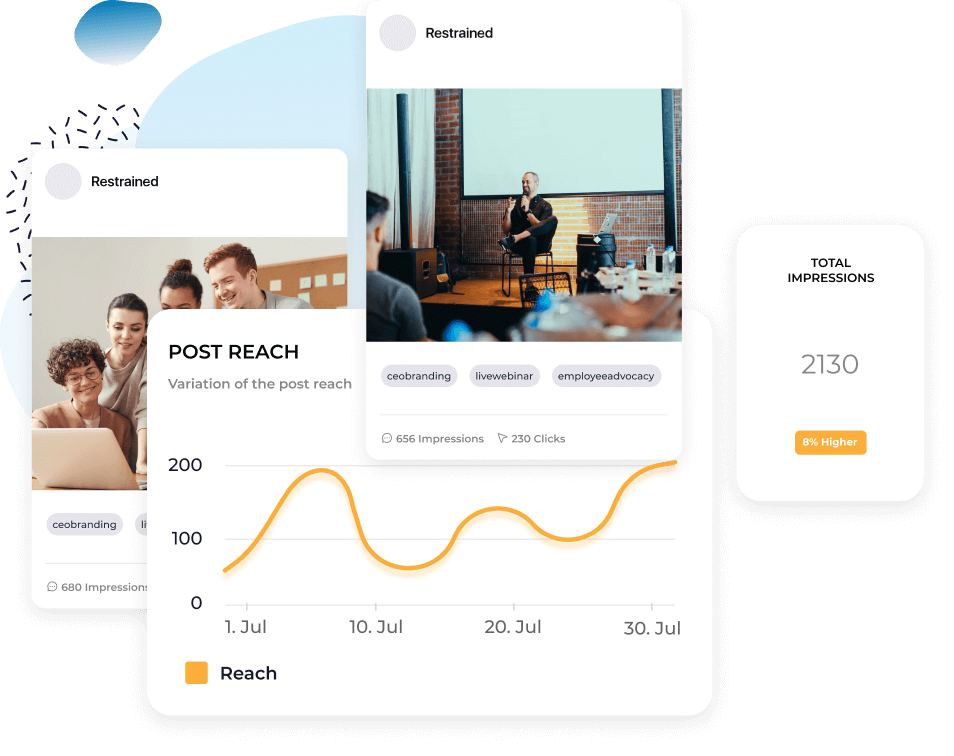
Reach (available in Socialinsider)
Reach is the number of people who have seen your LinkedIn content. This is the count of unique viewers of each LinkedIn post.
Understanding how many people each of your posts reaches helps you to see how your content is doing against the LinkedIn algorithm. Ideally, your post reach is equal to or greater than the number of followers your LinkedIn account has.
Note: If you’re checking this metric in your native LinkedIn analytics dashboard, it will be called “unique impressions” instead of reach.
Impressions (available in Socialinsider)
Impressions refers to the number of times your post has been seen. This number may be greater than reach as it will count all views, rather than individual people who have seen your post. So if someone has viewed your post twice, that would count as one towards reach, but two towards impressions.
You want your impressions to be higher than reach because it means that people may be coming back to check out your content again and again—a good sign that it’s resonating with your audience.
Engagement (available in Socialinsider)
Engagement refers to the number of interactions people have had with your content. On LinkedIn, this includes interactions like:
- Likes/reactions
- Comments
- Reposts
- Link clicks
- Video views
- Follows
If you’re posting content and not receiving any engagement, you need to rethink your content strategy. People must not be resonating well enough with your posts if they’re not leaving any reactions or comments. Play around with different types of content until you start generating engagement.
Clicks (available in Socialinsider)
Clicks are the number of times someone has clicked on your LinkedIn post. This could include clicks on a link you’ve shared, clicks on your content to read more, clicks to your company page, or clicks on a document you’ve shared.
In Socialinsider, you’ll be able to see engagement data with or without clicks. This is because clicks are metrics you’ll only gain access to when you connect an authorized LinkedIn account that you manage.
This way, you can get a more accurate comparison of certain engagement metrics by comparing engagement rates without clicks to your competitors—while also having data like engagement rate with clicks for your internal usage.
Reactions (available in Socialinsider)
On LinkedIn, reactions refer to the number of ways someone can react to a post. What started as just “likes” when LinkedIn launched has now increased to:
- Like
- Celebrate
- Support
- Love
- Insightful
- Funny
Though many people may just leave a simple “like,” having the option for people to leave additional reactions gives you an idea of how they feel about your content. Plus, leaving a reaction other than a “like” takes more time, meaning they wanted to dedicate more to your post than a quick click of the “like” button.
Comments (available in Socialinsider)
Comments, of course, tell you how many people have left a comment on your LinkedIn posts. You want to see this number continue to grow as you grow your LinkedIn presence.
One great way to increase the number of comments you receive is to end each of your LinkedIn posts with a question. Aim to start some dialogue around your post’s topic to see if that engages your audience better.
Reposts (available in Socialinsider)
Reposts (also known as shares) refers to the number of times someone shared or reposted your post onto their own profile or company page. When people repost your content, it opens you up to reaching a whole new audience—so you want to increase reposts.
Start by having your employees re-share your content (we’ll talk a bit more about this in the employee advocacy analytics section) and make sure to continue creating content that your audience will enjoy.
Engagement rate (available in Socialinsider)
Engagement rate is found by dividing your total engagement by your total followers, total reach, or total impressions (then multiplying by 100 to get it in percentage form). You’ll find all three of these engagement rate calculations within your Socialinsider dashboard to give you a clear idea of how engaged your audience is.
Top-performing posts sorted by engagement (available in Socialinsider)
In the Posts section of your Socialinsider dashboard, you can get a line-up of your top-performing posts sorted by engagement. You can also filter to view them by:
- Engagement rate
- Date
- Engagement/impressions rate
- Impressions
- Clicks
- Views
Again, look for patterns to see if you can tell which types of posts are remaining at the top, no matter which way you sort.
Content formats sorted by impressions (available in Socialinsider)
Under the Impressions tab of your Socialinsider insights, you can view your Post types by impressions bar chart. This shows you which types of posts (i.e., link shares, images, videos, polls, native documents, text, carousels) are getting the most impressions so that you can create more of that post type.
Video views (available in Socialinsider)
Under the Engagement tab in Socialinsider, you can scroll down until you reach the various video metrics—one of the most important being your video views.
Video views show you how many views your videos have gotten. Keep in mind that on LinkedIn, a video view is counted after someone has been watching your video for at least three seconds. Video views are also counted if someone watched your video more than once.
Although you can also get metrics like:
- Average views per video
- Total watch time
- Average watch time per video
Content pillars analysis (available in Socialinsider)
Content pillars are the main topics that your business publishes content around. With Socialinsider, you can easily tag your posts into different campaigns based on their content pillar. Do this in the Campaigns tab of your dashboard.
This gives you insights into which content pillars are performing best. Perhaps a certain topic resonates better on LinkedIn while other topics might perform better on other platforms. Adjust your content strategy accordingly.
Next, you’ll want to dive into your visitor analytics to get an idea of who is checking out your LinkedIn company page. You’ll find these metrics within your native LinkedIn analytics dashboard.
Let’s walk through each section of the LinkedIn visitor metrics to give you a better idea of the data analytics you can find—and what it means for your strategy.
Visitor analytics
The visitor highlights gives you three main insights:
- Page views: The number of times your company page has been viewed
- Unique visitors: The number of unique individuals who have visited your company page
- Custom button clicks: If you have a custom button set up at the top of your company page, this tells you how many times it was clicked in a given reporting period
This highlights section provides the perfect birds eye view of your company page performance.
Visitor metrics
This area showcases visitor metrics that are based on your page traffic. Filter this by time ranges to watch the line graph adjust based on your request. You can also see how many people checked out your different page sections, the number of times your page was viewed, as well as your unique visitors (again).
Visitor demographics
Here, you can get a better understanding of the type of person that’s regularly visiting your company page based on their profile demographics.
Find details like:
- Job function
- Location
- Seniority
- Industry
- Company size
This can help you gauge whether or not you’re reaching the right people with your content.
Life page traffic
Life pages are custom pages that let you share more of your company culture with job seekers on LinkedIn. You can share more of what your company does, who works for you, and more. This is a great way to appeal to talent during hiring periods.
And you can get insights specifically about your life page performance under the Visitors tab. Find metrics like total visitors as well as unique visits to make sure people are checking out your published life page.
Follower analytics
The third tab in LinkedIn’s native analytics dashboard tells you all about the people who have actually clicked that Follow button and are now actively following your company page.
Let’s dive into the different follower metrics you can find within the native LinkedIn analytics tool.
Follower highlights
Get quick insights into your LinkedIn followers in the highlights area. You’ll find:
- Total followers: The total number of followers your company has on the platform
- New followers: Your follower growth within the last 30 days, along with your growth percentage
Follower metrics
In this section, you get access to a line graph showcasing how your follower growth has changed over a given period of time. While this graph will likely show some periods of growth and others of decline, you ideally want to see upward trends overall.
Follower demographics
This section houses similar data to the visitor demographics section. Find out who is following you based on their set LinkedIn demographics. You’ll see info like:
- Job function
- Location
- Seniority
- Industry
- Company size
All followers
This section showcases your company page followers along with certain details about them plus when they followed your page, listed in order of recency.
Lead analytics
As LinkedIn is a professional social networking platform, it of course provides the option to generate leads. And it has an analytics report just for you to see how your lead generation is doing.
In this section, you’ll be able to see each lead generation campaign you’ve run, when it was created, its current status, and how many leads it’s generated. Then, you’ll be able to download a file of all leads to add to your CRM and start nurturing them.
Newsletter analytics
If your company has started its own LinkedIn newsletter, you’ll want to pay attention to this section in your LinkedIn analytics platform—it’ll help you get an idea of how your newsletter is performing.
Let’s dig through the sections available in the LinkedIn newsletter analytics report.
Trends
See trends of your newsletter over a given time frame. The specific metrics you can find here are:
- Article views: The number of times your newsletter content has been seen
- New subscribers: The number of new people who have subscribed to your newsletter
You’ll also see a line graph so you can visually see any growth.
Article totals
Here, you’ll get key metrics from your newsletter, like:
- Impressions: Total number of views your newsletter has gotten
- Engagements: Total number of engagements your newsletter has gotten
- Article views: Total number of times someone has clicked on one of your articles to open and read it
Subscriber demographics
Filter through your subscribers based on their:
- Job function
- Location
- Seniority
- Industry
- Company size
New subscribers
View your subscribers in order of recency. You’ll see snippets of their profile, showing you their job title and level of connection.
Competitor analytics
Next, you can find your LinkedIn competitor analytics. First, you’ll need to add pages that you want to compare your own performance to.
From there, you’ll get access to a couple new sections that can help you track your growth versus their growth.
Competitor highlights
Here, you can see how many posts you shared versus your competitors within the last 30 days, as well as your engagement rate versus theirs.
New follower metrics
See where you rank in new followers versus the competition over the last 30 days in this chart.
Organic content metrics
See where you rank in total engagements and total posts amongst your competition with this section.
Employee advocacy analytics
This section tells you which employee advocacy metrics to track, giving you an idea of how active your employees are on the platform. As LinkedIn is focused more on professionalism, many employees use it to promote or mention the brands they work for.
This is called employee advocacy—when your team members are actively advocating for your company—and can be a great way to reach a wider audience and generate more leads and sales.
If you’re wanting to run an employee advocacy campaign, you’ll want to take advantage of this section. It gives you details like:
- How many employees are posting
- How many LinkedIn members are interacting with your employees
- Content that’s been recommended to your employees
There are a number of different metrics you can track here, depending on what you’re looking to get out of your employee advocacy program.
How do you see post analytics on LinkedIn?
One of the best reporting features within the platform is the ability to see individual LinkedIn post analytics. This section falls under the Content engagement section under Content analytics within LinkedIn’s own platform.
There you’ll be able to see engagement data on a post-by-post basis, tucked into a neat graph. You’ll be able to see the following information:
- Post title
- Audience
- Boost available
- Posted by
- Date created
- Impressions
- Views
- Clicks
- CTR
- Reactions
- Comments
- Reposts
- Follows
- Engagement rate
- Engagements
However, you can also find all of that information and more within your Socialinsider dashboard. Head over to the Posts section, then click the View Analytics text at the bottom of each post to get even more in-depth Linkedin analytics reports about each of your posts.
Here, you’ll get details like:
- Hashtags
- Reactions
- Comments
- Shares
- Reach
- Impressions
- Link clicks
- Engagement
- Engagement rate
- Engagement/impressions rate
- Engagement distribution over time
Plus, the posts section of Socialinsider allows you to sort your posts to find the best performing ones based on different metrics, like engagement, engagement rate, clicks, and more.
This way, you can see your top performing posts in order, as well as click to get more individualized details for each one.
How do you read a LinkedIn analytics report?
Need to analyze analytics but not sure how to get a good read on your report? Let’s talk about how to do a LinkedIn analysis so that you can clearly understand what your metrics are telling you.
First start with your performance tracking. This will showcase key metrics surrounding your individual post performance and your LinkedIn analytics as a whole.
For example, you might want to look at:
- Your top posts
- The type of posts they are
- How much reach and engagement you’re getting
- How much your reach and engagement increased from the last reporting period
From there, you can move onto audience demographics. Look at data like:
- Total followers
- Follower growth
- Follower demographics
While many people think follower count is just a vanity metric (i.e., just for show), looking at your growth is still important because it shows you how many people care about your business or content enough to actively follow it.
From there, you can look at some content optimization ideas. You already covered some important metrics when you looked at performance tracking. Those should give you a good idea of things like:
- Is your content strategy currently working?
- Is there a type of post that’s outperforming other types of posts?
- Can you optimize your strategy by sharing more high-performing content?
Next, consider your LinkedIn advertising budget. Are there any posts you might want to boost to further ramp up their reach and engagement? Boosting already well-performing content can help get it in front of an even larger audience.
Finally, look at strategy adjustments as a whole. Are you reaching the right audience? If not, how can you pivot to make sure your content is hitting the right target?
All of that information should help you understand your LinkedIn performance, read your data properly, and put you on an actionable path to moving forward.
How do you export LinkedIn analytics data?
There are two ways to export your LinkedIn performance report. You can do so within the LinkedIn dashboard or by using a third-party reporting tool. Like Socialinsider, naturally.
To export LinkedIn data directly from the source, head to your LinkedIn analytics dashboard. Choose which report you want to export—Content, Visitors, Followers, Competitors, Leads, or Employee Advocacy—and click on the corresponding tab.
From there, simply click on the Export button in the top right corner of the dashboard. Choose the right time frame (i.e., the last week, month, or quarter) and finalize your export.
You’ll be able to download your report in an XLS file so you can open it and make any additions or changes within Microsoft Excel.
However, like we mentioned, you can also export LinkedIn data using a robust social media analytics tool like Socialinsider. Get started by logging into your account and heading to your LinkedIn profile analytics dashboard.
You can export any of the individual reports available to you—Summary, Content, Engagement, Reach, Impressions, Audience, Posts, Compare, or Campaigns. First, select the time period you want to share. Then click the Download button in the top right corner of the report dashboard.
Then, select whether you want to download your report in XLS (Microsoft Excel), PDF (document), or PPT (Microsoft PowerPoint) format.
Setting up your Summary page with all of the key metrics you want to track, then exporting it as a PDF file is one of the simplest ways to compile your LinkedIn performance report. This way, there’s no additional work for you or your team to do—your summary has everything you need, and you just need to do a quick export before it’s ready to present.
개인 LinkedIn 프로필의 분석 데이터를 어떻게 확인할 수 있습니까?
개인 LinkedIn 프로필의 성과를 확인하고 싶으신가요? LinkedIn 내에서 직접 확인할 수 있습니다! 단, 서드파티 보고 도구로는 개인 LinkedIn 분석을 볼 수 없으니 참고하세요. 하지만 LinkedIn의 도구를 통해 기본적인 개요는 확인할 수 있습니다.
LinkedIn 프로필로 이동한 다음, 아래로 스크롤하면 분석 섹션을 볼 수 있습니다. 프로필에서 바로 최근 일주일간의 프로필 조회수, 게시물 임프레션, 검색 노출 횟수를 확인할 수 있습니다.
더 많은 데이터를 보려면 전체 분석 보기를 클릭하세요.
LinkedIn 프로필 분석에서는 다음과 같은 인사이트를 확인할 수 있습니다:
- 게시물 임프레션: 최근 7일 동안 게시물이 조회된 횟수와 백분율 변화 수치
- 팔로워: 전체 팔로워 수와 지난 7일간 변화한 수치
- 프로필 뷰어: 최근 90일간 프로필을 본 개별 인원 수
- 검색 노출: 지난 일주일간 다른 사용자의 LinkedIn 검색 결과에 프로필이 표시된 횟수
또한 프로필을 활성화 상태로 유지하기 위한 추천 작업과 이용 가능한 크리에이터 도구도 관리할 수 있습니다.
Get more from your LinkedIn analytics data
Socialinsider 무료 체험을 시작하세요. 기본 LinkedIn 분석에서 볼 수 없는 숨겨진 인사이트를 확인할 수 있습니다.