2025年Instagramストーリーズ ベンチマーク
最新の2025年Instagramストーリーズ ベンチマークをチェックしましょう。ストラテジーを最適化し、オーディエンスとのエンゲージメントを高めるための貴重なインサイトを入手できます。

Instagramストーリーズは変化しました。2025年は、リーチよりも維持に重きが置かれています。
今も効果的な点と、効果が薄れた点を理解するために、フォロワー数やフォーマットごとに161,180本のストーリーズを分析しました。本調査では、リーチやインプレッション、退出、進むタップに至るまで、視聴者行動の変化を詳しく解説します。
その結果は?推測をやめて最適化を目指すソーシャルメディアマネージャーやブランドマーケター向けに作られた、明確でデータに基づくInstagramベンチマークレポートです。
詳しく見ていきましょう。
エグゼクティブサマリー
- 大規模ブランドはストーリーズの活用がより活発です。
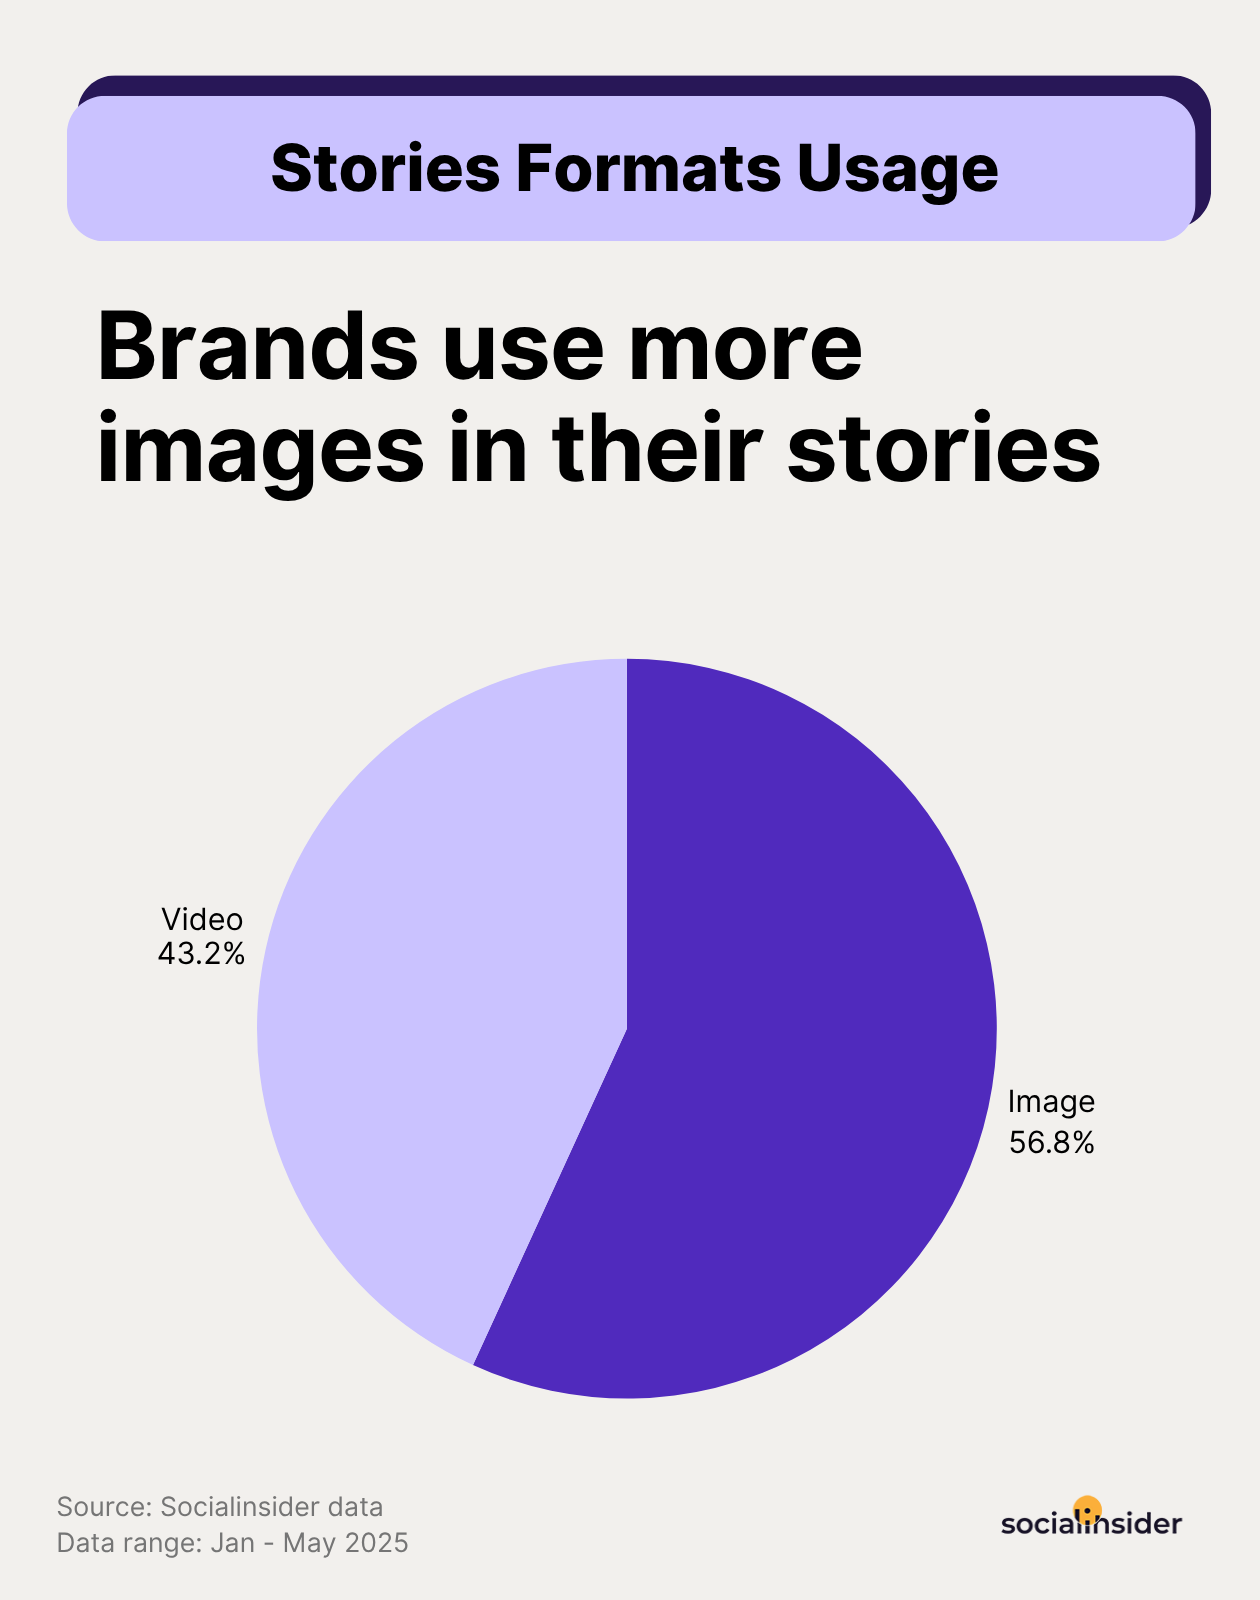
- ブランドのInstagramストーリーズは画像が動画より多く占めています(56%対44%)。
- 最初の3つのストーリーズの後に最も多くの退出が発生しています。退出率は2024年と比べて上昇しています。
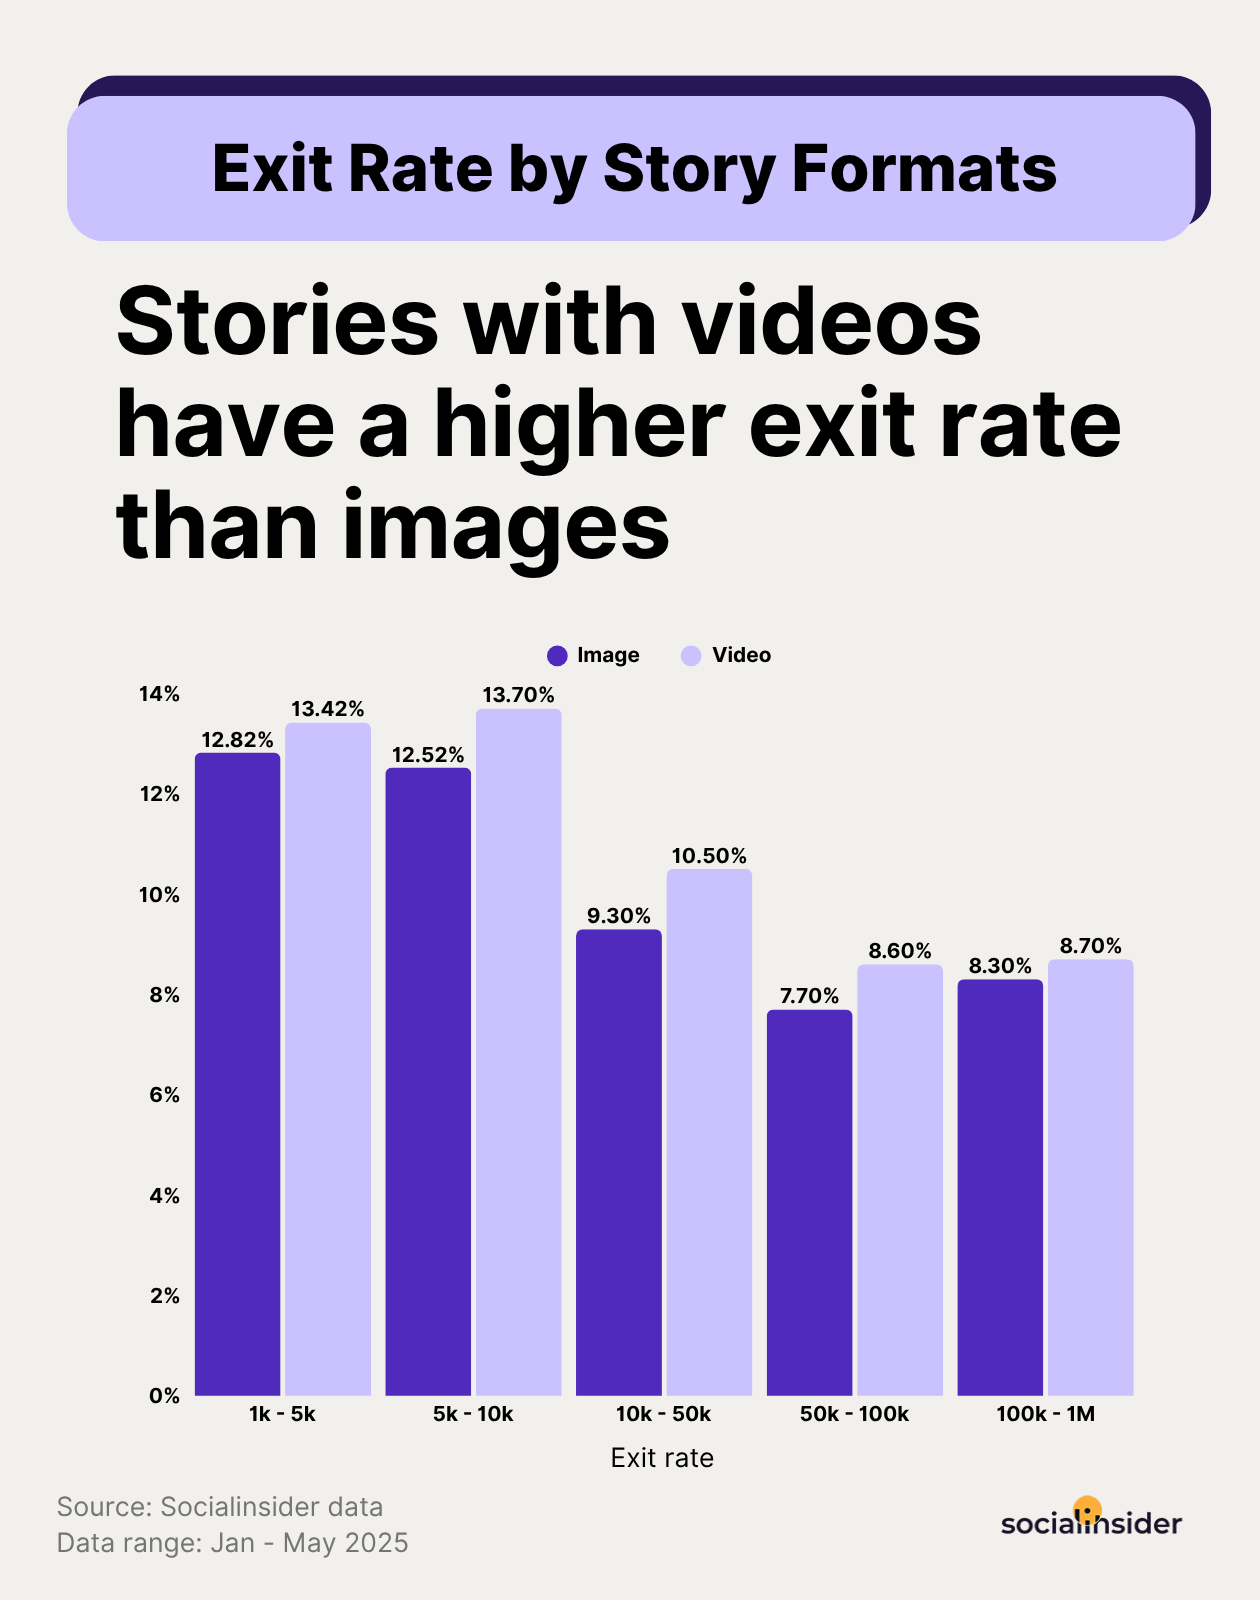
- 動画付きストーリーズは画像よりも退出率が高いです。
- 画像ストーリーズでは特にユーザーがタップフォワードします。
- リーチが最も伸びるのは6~13ストーリーズの間です。
- 動画ストーリーズはより高いリーチを生み出します。
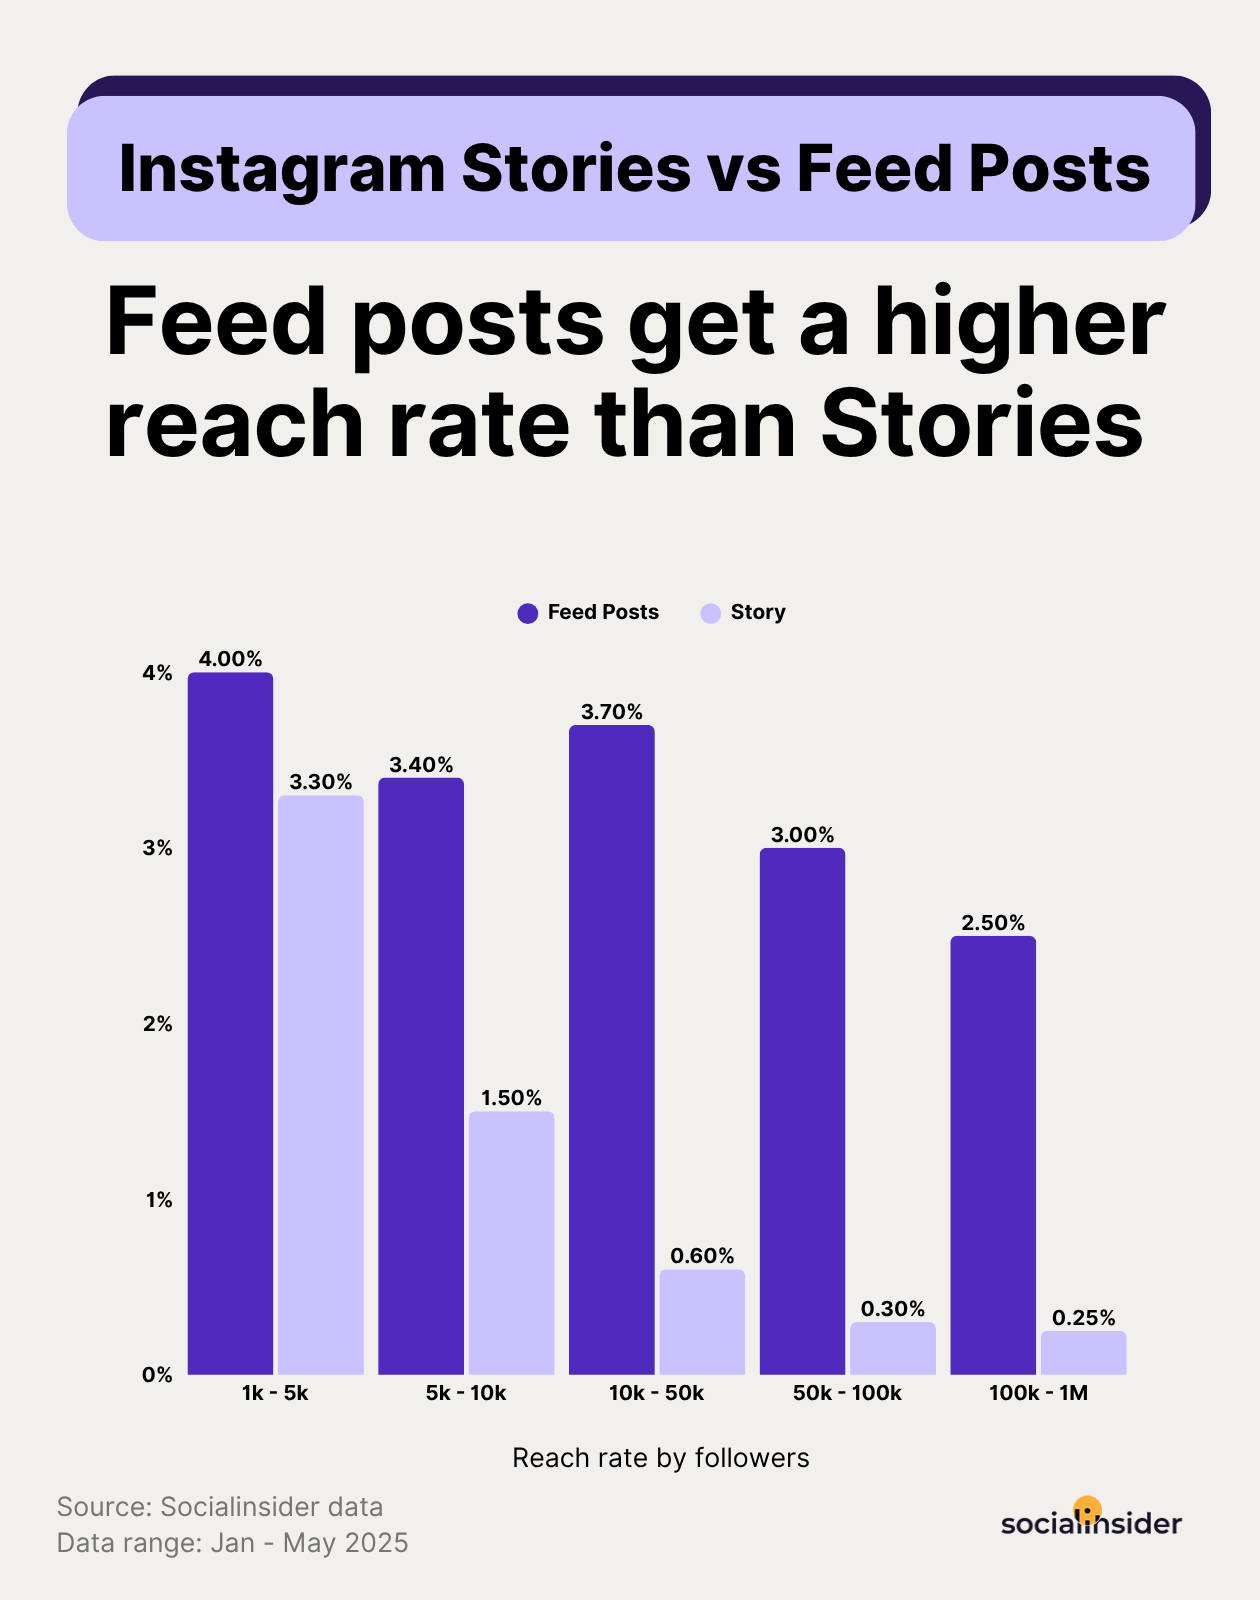
- フィード投稿はストーリーズよりもリーチが高くなります。
- ストーリーズが10件になると、インプレッションが最も増加します。
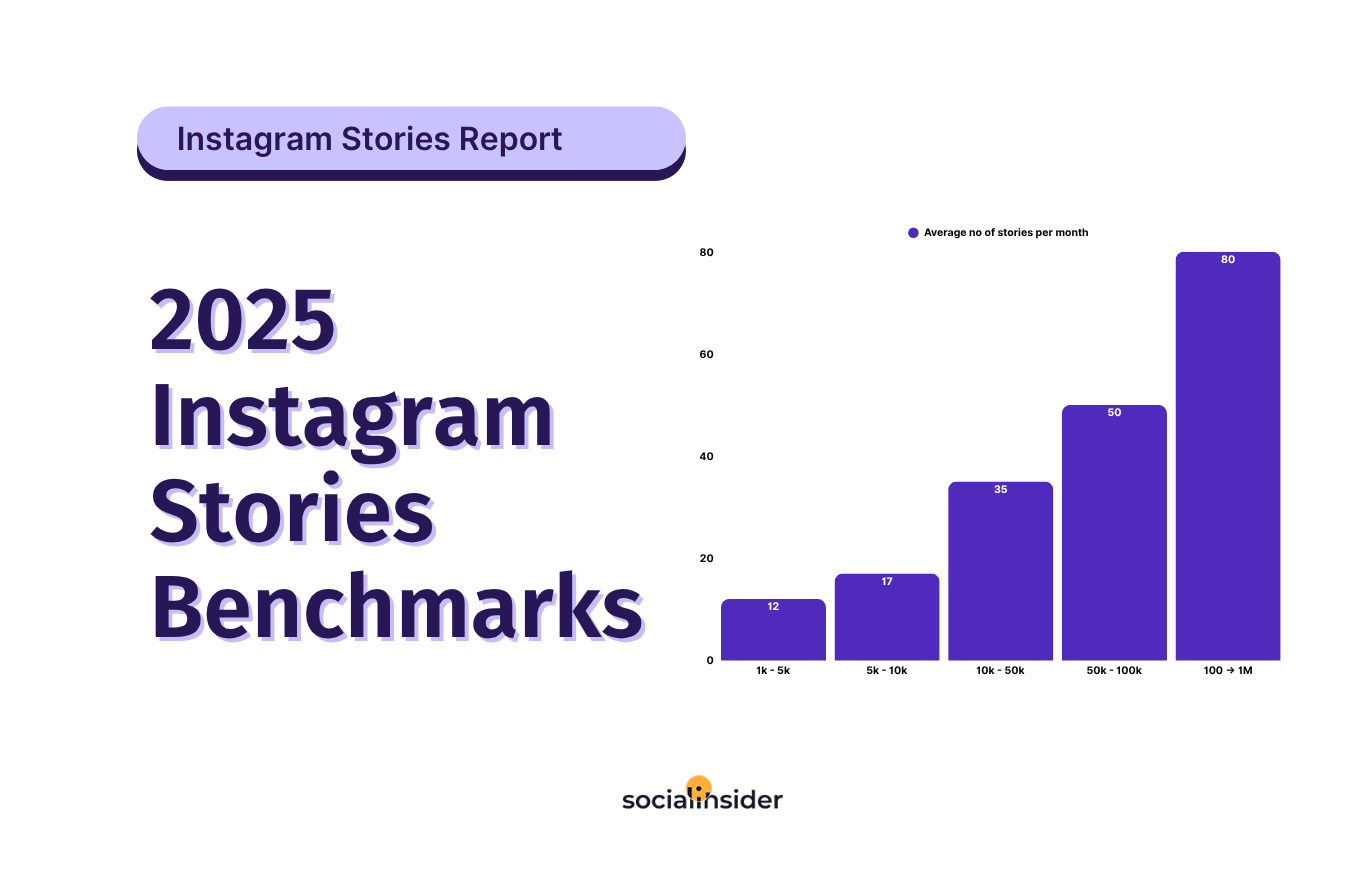
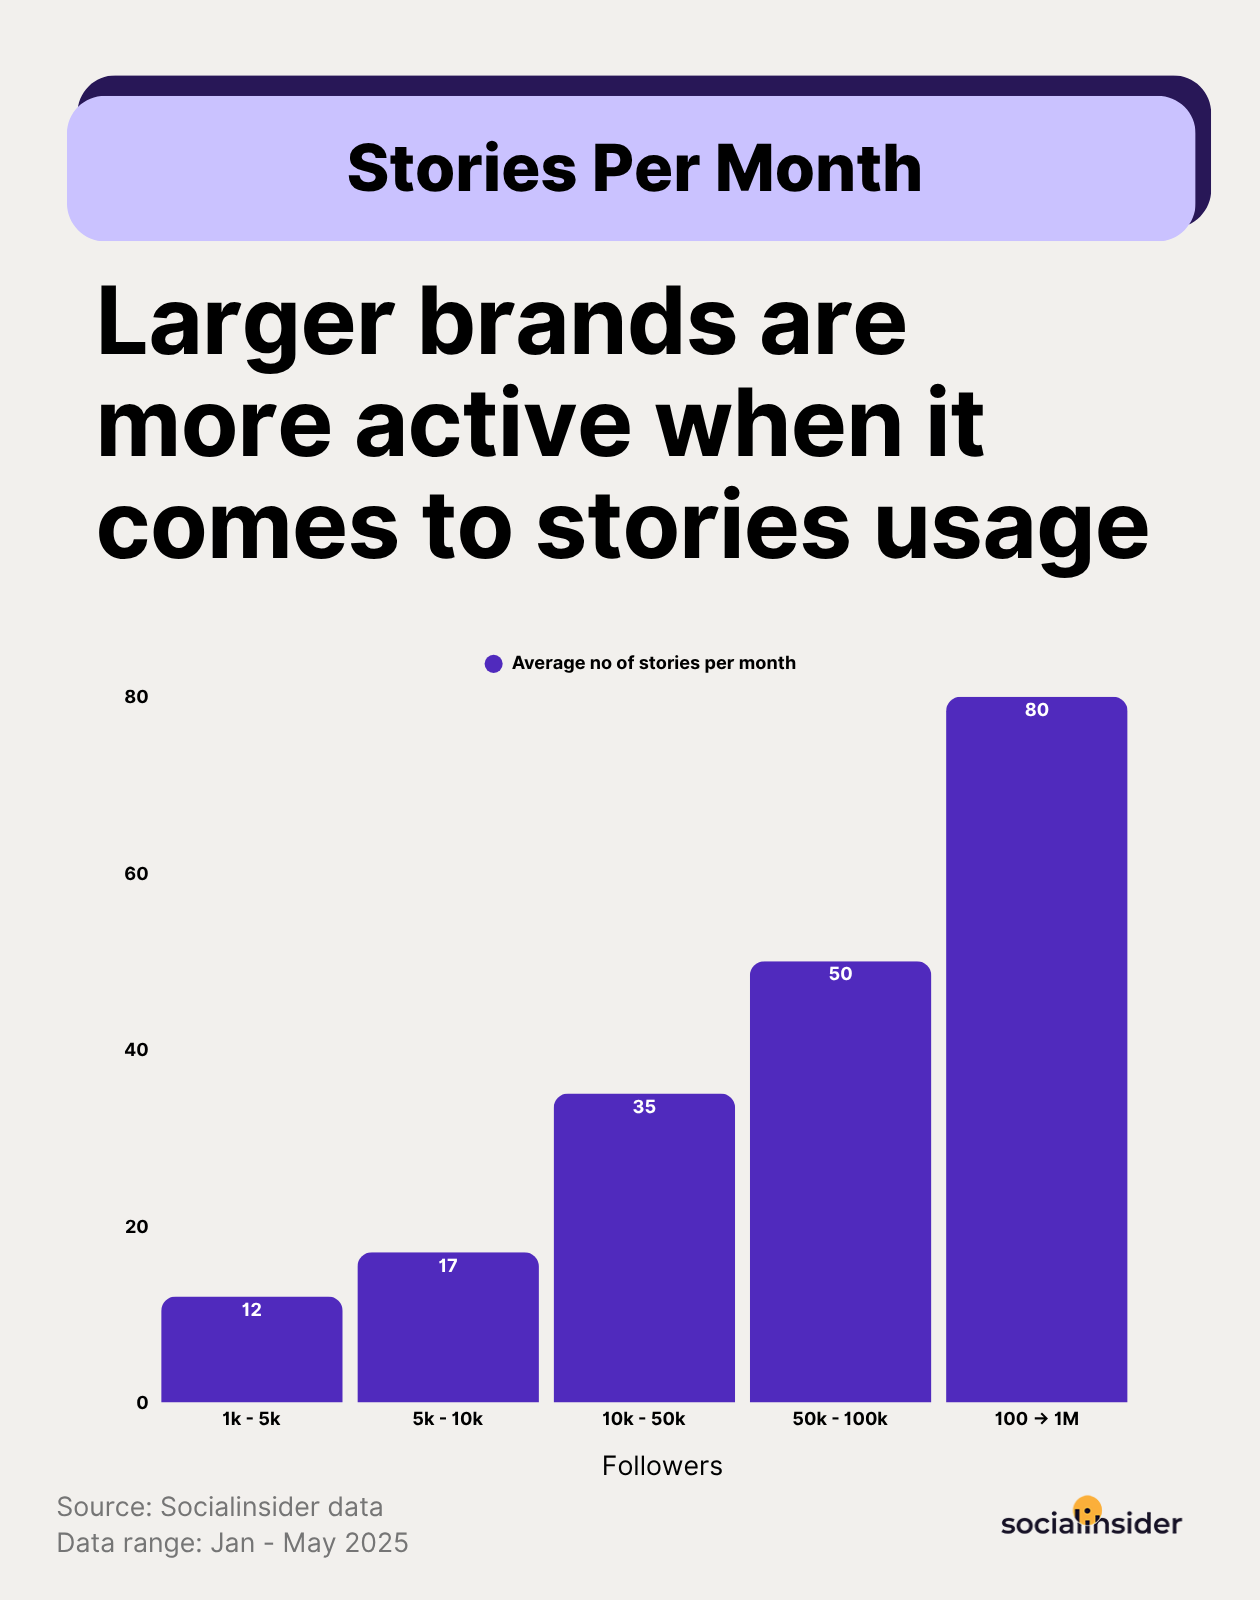
Instagramストーリーズ投稿頻度
本質を見極めましょう。Instagramストーリーズは、かつてのような役割を果たしていません。初期は発見の強力なエンジンであり、リーチを拡大し新しいオーディエンスへ簡単にアプローチできる存在でした。しかし2025年、状況は変わりました。ストーリーズはもはやファネルの上位で輝く存在ではありません。今の強みは リテンションと継続的なインタラクションです。
ストーリーズは、ブランドが既存のフォロワーと直接つながる安定したチャネルを提供します。見込み顧客の育成、ブランドロイヤルティの強化、ローンチサイクル中の認知維持など。ストーリーズは日々のブランド運用に欠かせない要素です。
そして頻度は重要な役割を果たします。データは、ブランドがオーディエンスの増加に伴いストーリーズの投稿数を増やしていることを明確に示しています。
- 1,000~5,000フォロワー → 月12本のストーリーズ(週約3本)
- 5,000~10,000フォロワー → 月17本のストーリーズ(2日に1本ペース)
- 10,000~50,000フォロワー → 月35本のストーリーズ(1日1本程度)
- 50,000~100,000フォロワー → 月50本のストーリーズ(1日約2本)
- 100,000〜1,000,000フォロワー → 1か月あたり80ストーリーズ(1日約3ストーリーズ)
この変化には理由があります。オーディエンスの期待が高まっていることを反映しています。ブランドが成長するにつれ、ストーリーズでの存在感が重要になり、信頼と関連性を維持する鍵になります。
オーディエンスを惹きつけ続けるため、投稿頻度を最適化する戦略的な戦術です。
- 規模に合わせて投稿頻度を調整しましょう。 フォロワー2,000人なら月12回投稿で十分でも、50,000人なら話は別です。そのままでは沈黙と同じです。規模が大きくなるほど、投稿回数も増やす必要があります。
- 断片ではなく、ストーリー全体を意識しましょう。 月に50件以上ストーリーズを投稿するアカウントは、単なる近況報告ではありません。ポール → 商品紹介 → パーソナリティという流れで、連続したストーリーを伝えています。ここで本当のエンゲージメントが生まれます。
- 量だけでなく、深さを考えましょう。ストーリーズのリーチが減少しても、慌てないでください。それは関連性を高めるサインです。最適なコンテンツを、最適な人に、最適なタイミングで届けましょう。リテンションこそが新しいリーチです。
Instagramストーリーズ利用状況
Once you’ve nailed how often to post, the next question is just as critical: どんなストーリーズを投稿すべきですか?
2025年のデータは、ブランドアカウント全体でのフォーマット分布を明確に示しています。
- 画像 → 57%
- 動画 → 43%
それでは、なぜ画像が今もなお主流なのでしょうか。
まず、画像はスケーラブルだからです。1か月に80本のストーリーズを投稿するブランドは、ペースを維持するためテンプレート化されたビジュアルを活用しています。小規模アカウントにとっても、画像ベースのストーリーズは多くの制作負担をかけずにアクティブな運用を継続できる低リスクな方法です。
However, the brands seeing the most meaningful interaction often strike a deliberate balance. They don’t just alternate formats - they choose formats based on intent.
Quick announcements? Images.
製品デモ、舞台裏、UGCの特集には必ず動画です。
効果的なストーリーズ投稿戦略のための戦術
- 順番が重要です。理想的なフォーマットの組み合わせはこうです。画像スライドで注目を集める → ショート動画で内容を深める → ポルやステッカーで交流する。この流れでユーザーのタップが続き、離脱が減ります。
- フォーマットはメッセージのために使いましょう。 すべての投稿に動きを入れる必要はありません。シンプルな情報なら画像で十分です。ですが、エネルギーや個性、説明が必要な場合は動画を選びましょう。
- 動画を深く考えすぎないでください。 スタジオの準備は必要ありません。実際、カジュアルでリアルなストーリーズの方が、凝ったものよりも高いパフォーマンスを発揮することが多いです。スマートフォンを手に取り、カメラに話しかけて、短くまとめましょう。
ストーリーズ退出率ベンチマーク
退出率について話しましょう。これは、Instagramストーリーズのパフォーマンスで最も率直なメトリクスと言えるでしょう。リーチしたかどうかだけでなく、どのタイミングで離脱したかが分かります。そこに、本当のインサイトがあります。
1~15本連続のInstagramストーリーズで退出率を分析すると、明確な行動パターンが見えてきます。私たちが発見した内容をご紹介します。
1~3本のストーリーズ:重要な離脱ゾーン
- 最初のストーリーズで退出率は23.8%から始まります。
- 2枚目で20.5%、3枚目で18.5%に下がります。
- ここが最も視聴者が離脱するタイミングです。スライド1枚目の後、約4人に1人が離脱します。
- 最初に注目を引けないと、視聴者は続けてくれない可能性が高いです。
4〜9ストーリーズ:維持率が安定する期間
- Exit rates continue to decline gradually: 15.7% at slide 4, dropping to 13.3% at slide 9.
- This range shows strong viewer retention. Once users are invested, they are significantly more likely to continue tapping through the full sequence.
10–15 Stories: The secondary drop-off phase
- While not as sharp as the early drop, this suggests a point of fatigue where viewers begin to disengage again.
By Story 15 exit rates go around 12.5%.
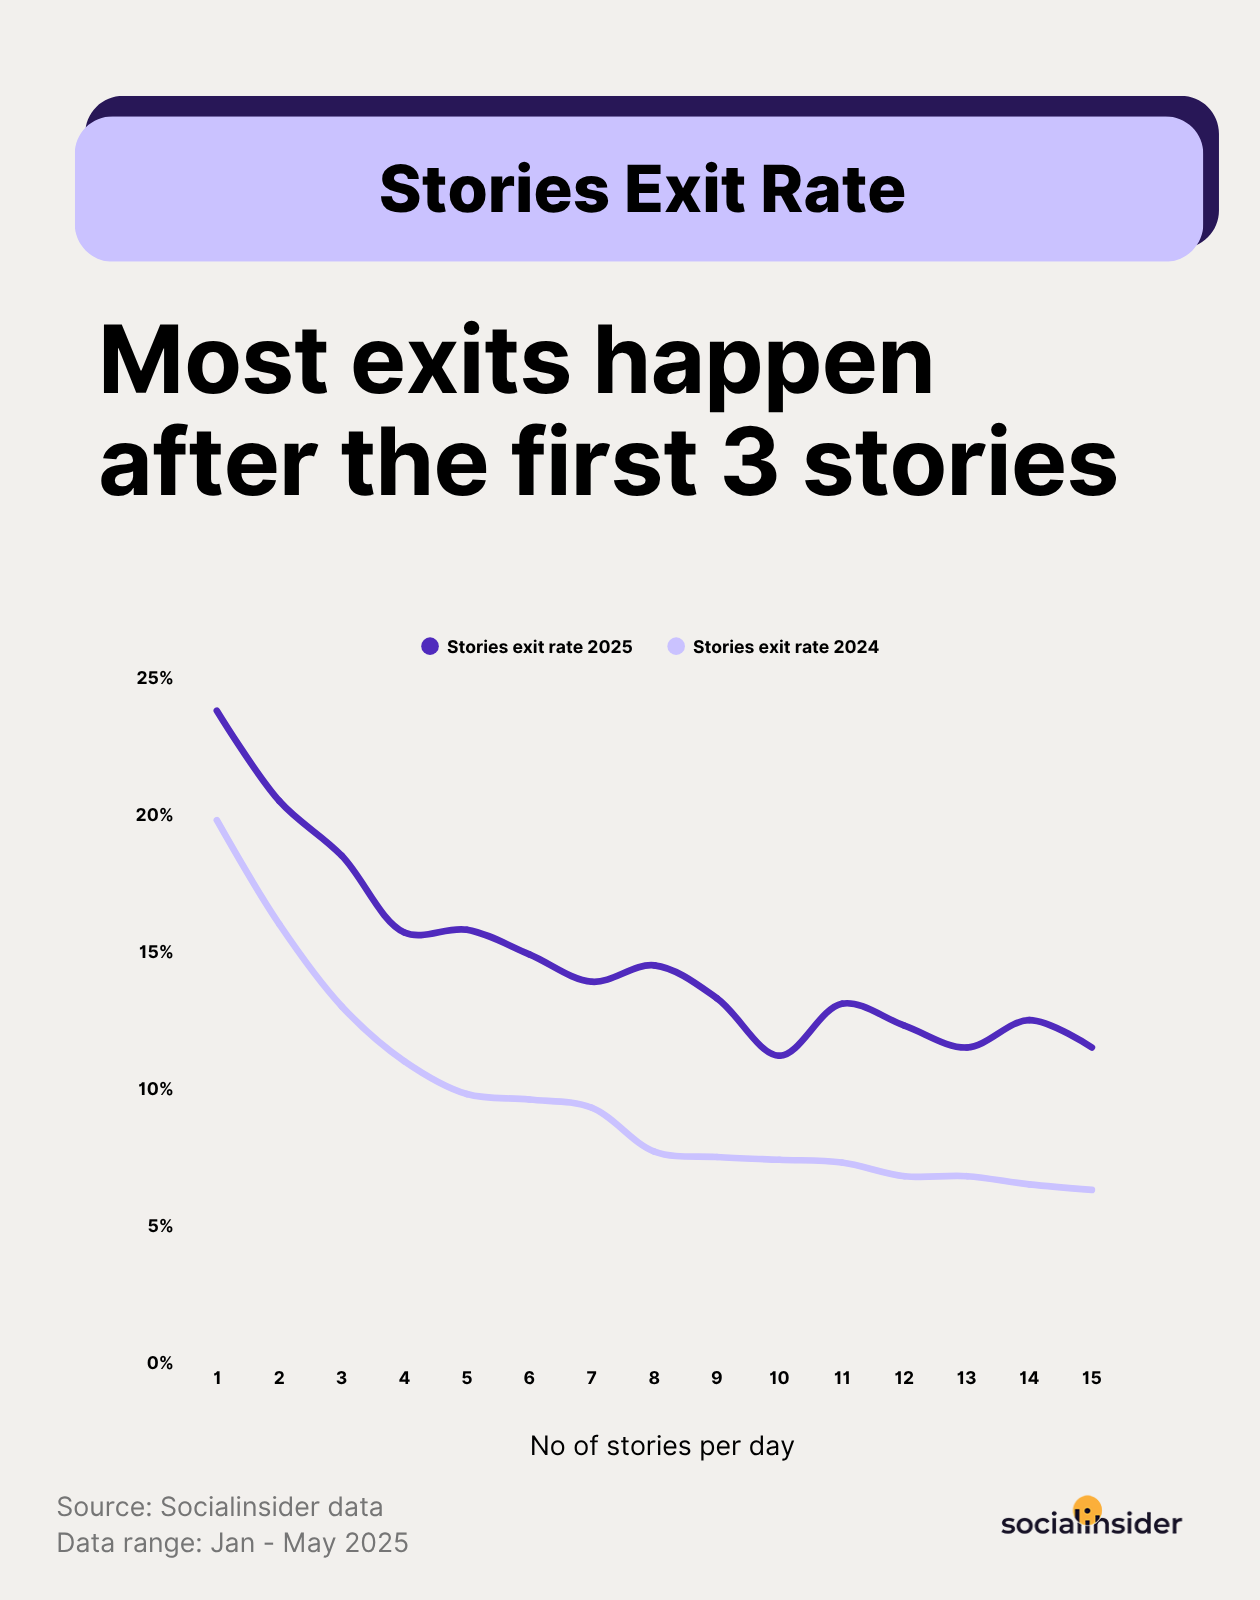
Additionally, we’re seeing a 全体的に退出率が明確に上昇しています。 2025年に, and that says a lot about how audience behavior is evolving.
2024年、ストーリーズの退出率はスライドを増やすごとに安定して下がっていました。価値を提供すればするほど、ユーザーは長く滞在するというメッセージでした。しかし2025年は違います。その傾向は変化しています。オーディエンスはよりせっかちに、そしてはるかに選択的になっています。
ソーシャルメディアでは「動画が王様」とよく言われています。しかし動画にも重要な役割がある一方、Instagramストーリーズに関しては、データがよりバランスの取れた結果を示しています。
フォロワー数ごとに、画像と動画で平均離脱率を比較しました。正直に言うと、その違いはかなり小さいです。
リテンション率を高める戦略的な施策
- 最初の3枚のスライドを最優先にしましょう。離脱率は序盤が最も高くなります。そのため、冒頭のスライドが最も重要です。強いビジュアル、すぐに分かるコンテキスト、明確なストーリーフックがリテンションを大きく向上させます。
- Use slides 4–9 to build depth.This mid-section holds the most stable engagement. It’s the ideal window for storytelling, product education, or layered messaging. This is where your audience is most open to detailed content.
- スライド10以降もエンゲージメントを強化しましょう。As slight fatigue begins to set in after slide 9, adding interaction—polls, questions, or a format shift—can re-engage viewers and maintain momentum through to the final slide.
- フォーマットよりもまず関連性に注力しましょう。 コンテンツがタイムリーで役立つと感じられなければ、どんなフォーマットでも効果は期待できません。強いフックがある優れた静止スライドは、曖昧で遅い動画よりも常に成果を上げます。
- 両方を使い、自然なリズムを作りましょう。 静止スライドが多すぎると単調になります。動画が多すぎると重く感じます。両方をミックスすることで、ストーリーズにペースとバラエティ、構成が生まれます。長いシーケンスでも離脱を防ぎやすくなります。
ストーリーズのタップフォワード率ベンチマーク
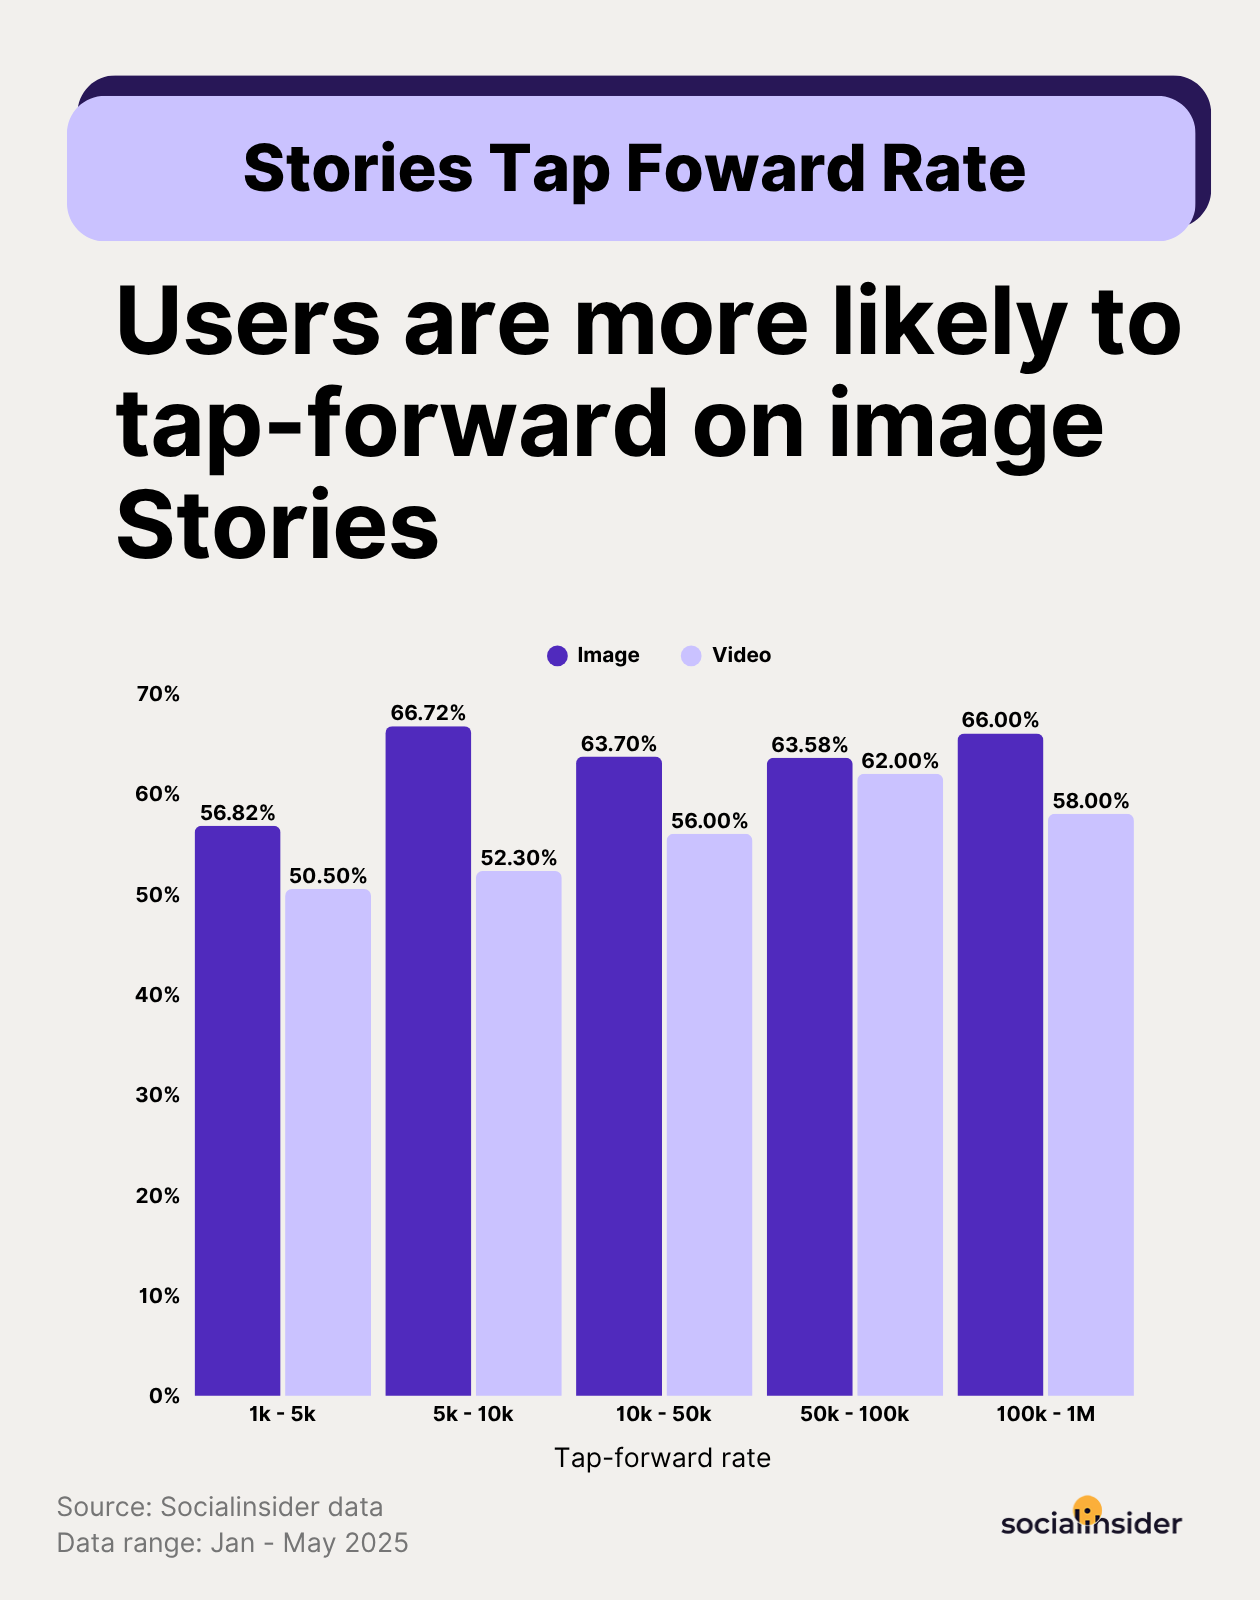
タップフォワードは一見シンプルなメトリクスに見えます。誰かが次のストーリーズに進むためにタップしただけのことのようですよね。しかし実際は、ストーリーズのクオリティやテンポを示す非常に重要なシグナルです。
フォロワー数の階層ごとにフォーマット別(画像と動画)のタップフォワード率を分析しました。その結果、動画は静止画像よりも視聴者の注目を集めることがわかりました。
タップフォワード率を下げるための戦略的な戦術です。
- 特に小規模アカウントでスキミングを減らすには、動画を活用しましょう。 フォロワーが10,000未満の場合、動画スライドは画像よりも一貫して高い成果を上げます。視聴者の動きを遅くし、長く注目を集め、ブランドの存在感も強まります。
- 中規模アカウントではフォーマットよりペースが重要です。 フォロワーが10,000~50,000の場合、動画はまだ優位ですが、その差は大きくありません。つまり、使うコンテンツだけでなく、ストーリーズのテンポが大切です。長いイントロやゆっくりした映像、テキストが多すぎる場合、動画でもタップフォワードが増加します。
- 複数フォーマットのシーケンスをテストして自分の流れを見つけてください。 まずインパクトのある動画から始め、画像CTAで続けます。長い動画なら複数のスライドに分けてみましょう。タップフォワード率はフォーマットの選択ではなく、次のタップにつながるシーケンス作りがポイントです。
Instagramストーリーズのリーチベンチマーク
We all know reach matters. It’s the top of the funnel. The invitation. If people don’t see your Stories, nothing else - no polls, no swipe-ups, no clever CTA - really works.
The question is: how many Stories does it take in 2025 to actually get seen? And more importantly: how has that changed since last year?
Let’s unpack that.
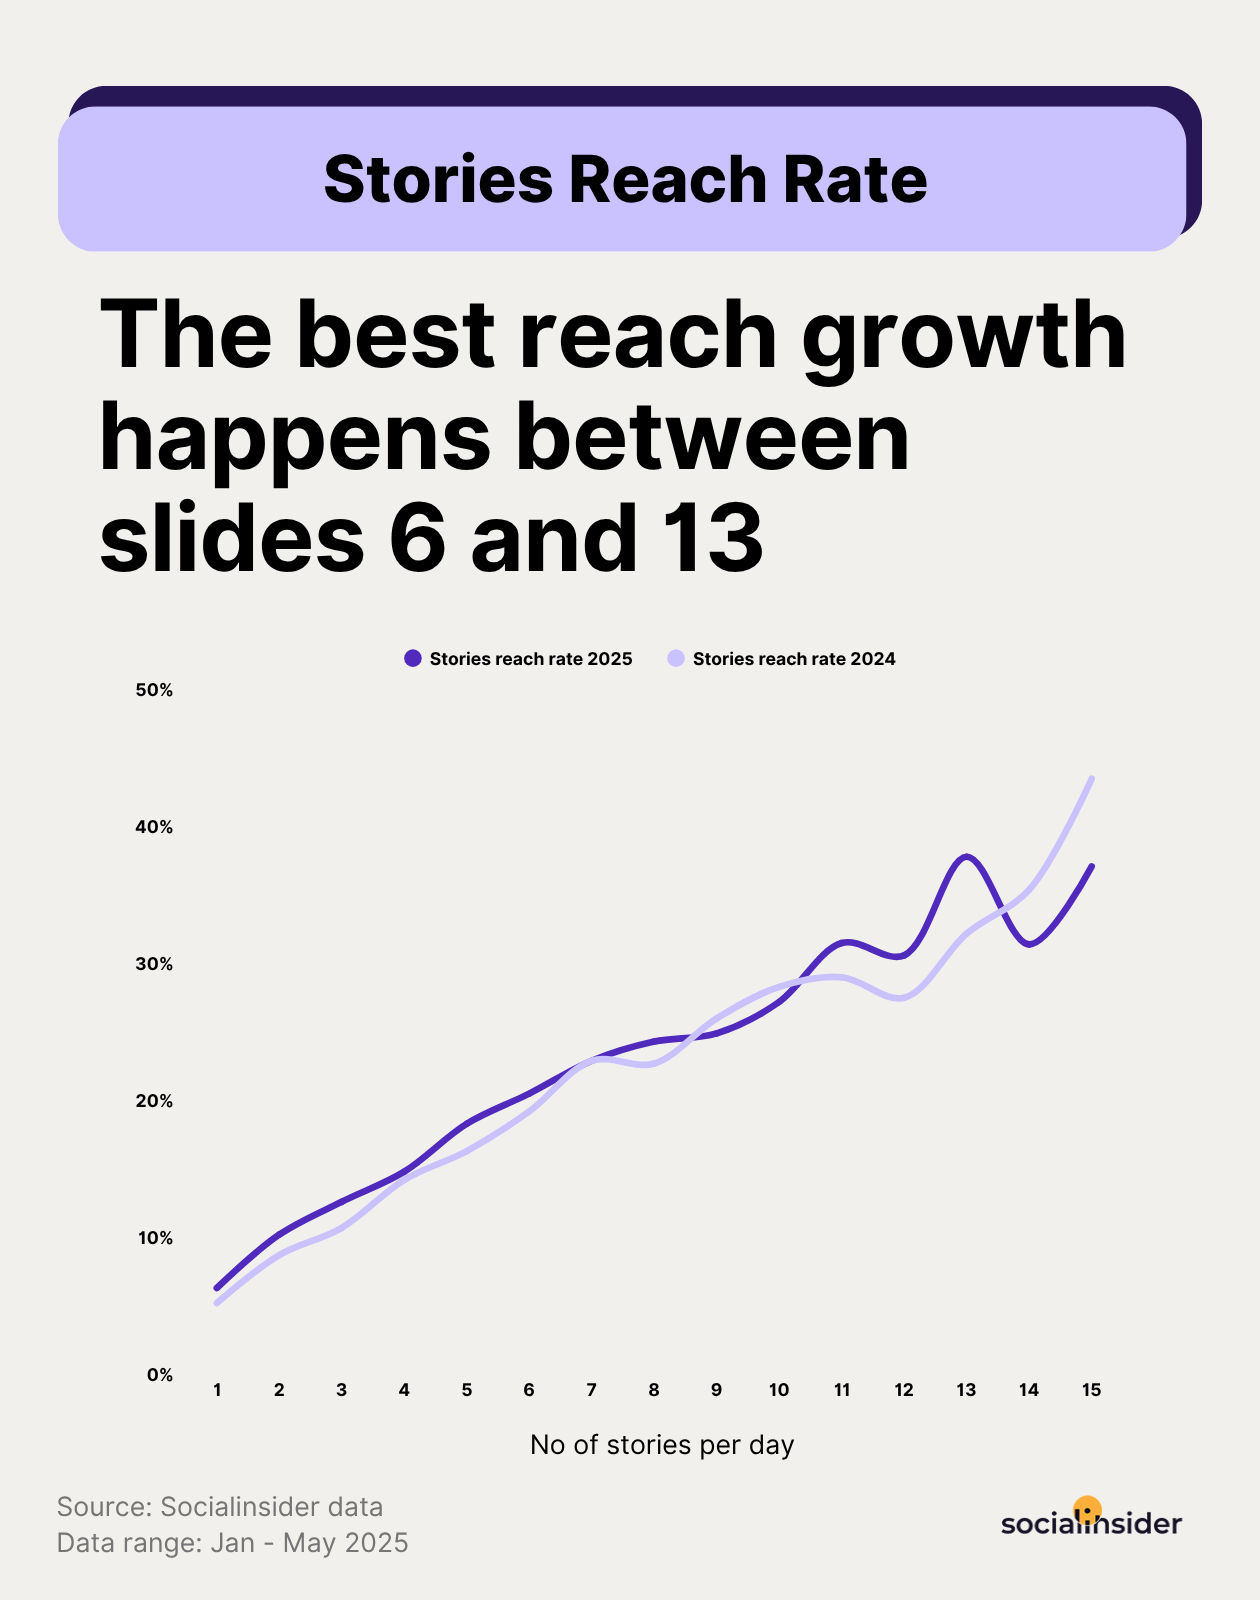
2024年はリーチがより直線的でした。投稿すればするほど見られる回数が増えました。とてもシンプルです。しかし、2025年には状況が変わりました。今ではシーケンスの中央が最も強いリーチゾーンになっています。投稿が少なすぎても多すぎても、露出が制限される場合があります。
- リーチ率は1枚目のスライドで6.3%、6枚目で20.5%まで急上昇します。
- 最適な投稿数はおおよそ6~13ストーリーズです。この範囲でリーチが安定して上昇し、13枚目では37.8%に達します。
- しかしその後はどうでしょうか。13枚目の37.8%から14枚目の31.4%、15枚目の37.1%へと明らかに減少しています。この減少は2024年には見られませんでした。
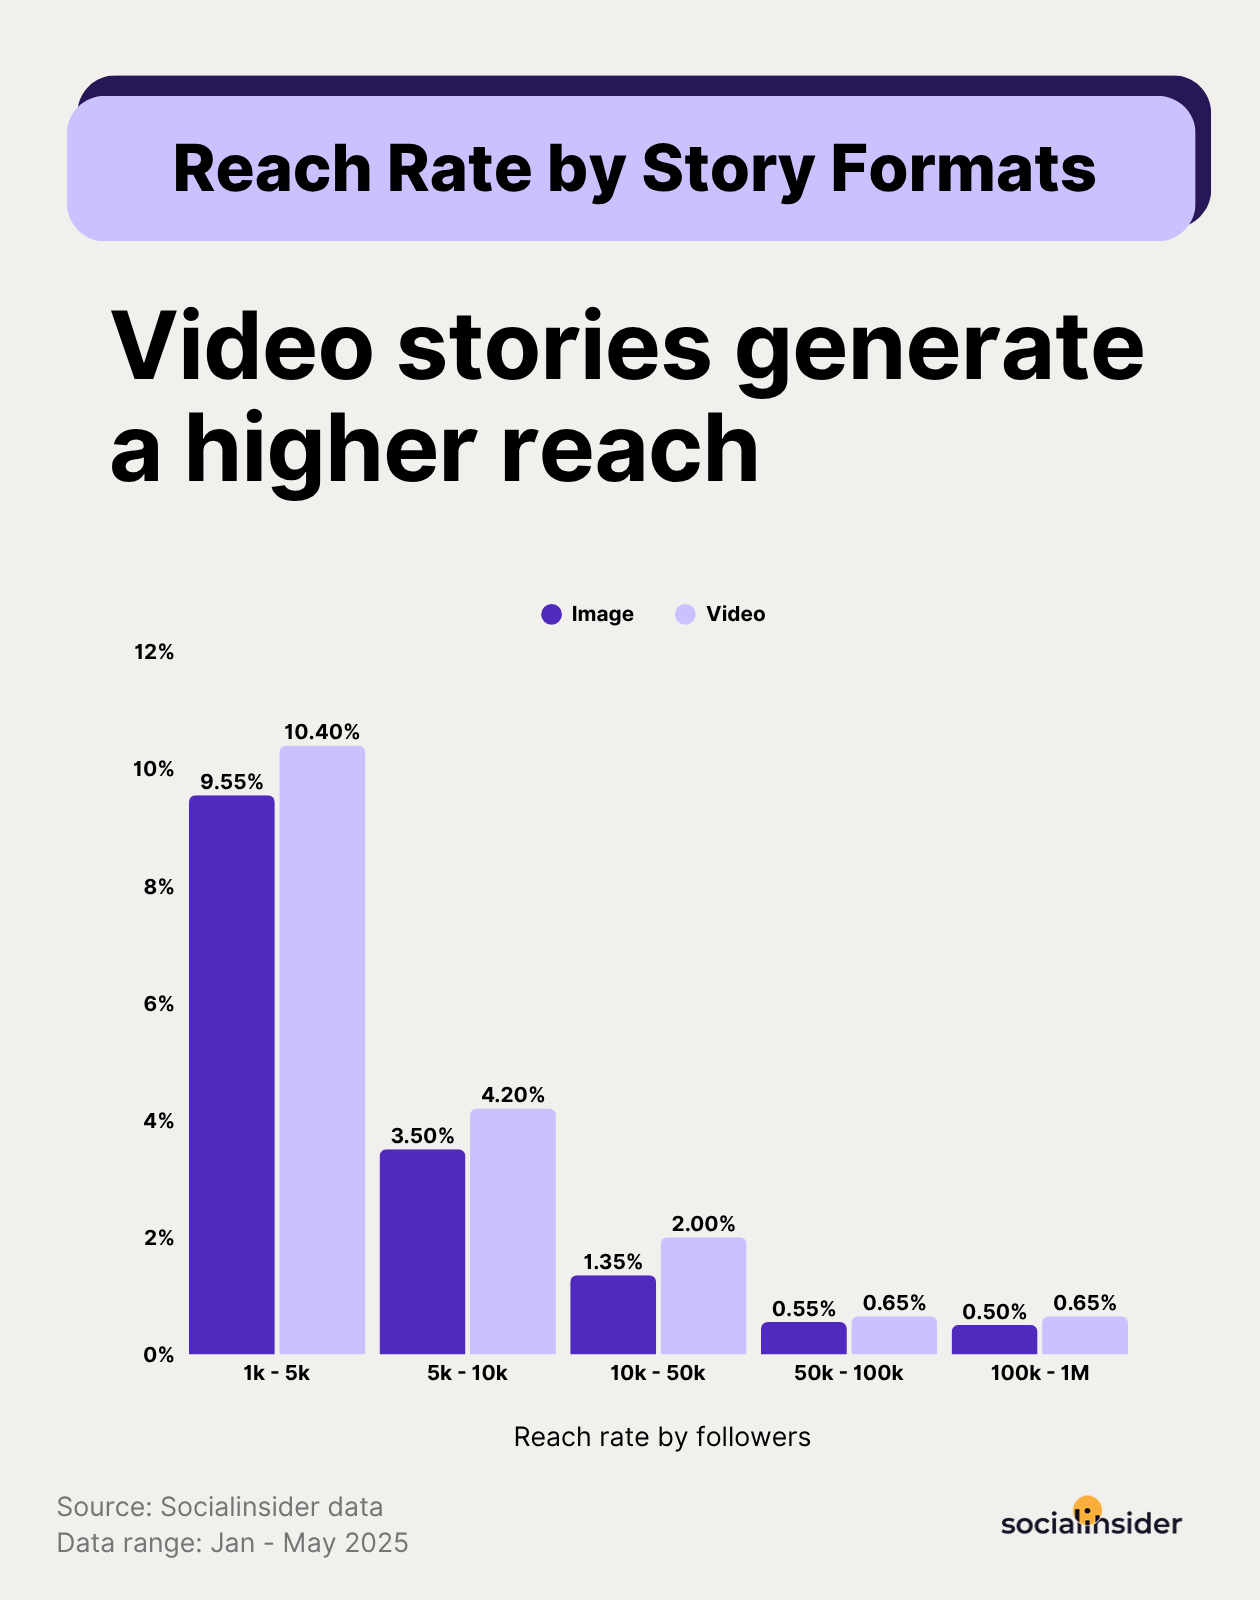
We already saw that the number of Stories you post affects your reach rate. But there are another factors at play: follower size and Stories formats—and it makes a bigger difference than most people expect.
Here’s how reach rate varies across different audience tiers, and how format (image vs. video) affects performance:
傾向は明確です。フォロワーが多いほど、全員にリーチするのが難しくなります。特にストーリーズではその傾向が顕著です。
減少幅は大きいですが、ひとつだけ変わらないことがあります。それは、動画が画像コンテンツよりも常に優れているという点です。
ストーリーズが注目を集めていた時代を覚えていますか?2025年には、もはやそうではありません。
ストーリーズはエンゲージメントやブランドイメージ作りに効果的なツールですが、リーチの点では以前ほど強みがありません。特にフィード投稿と比べると、その差は顕著です。フォロワー規模別にリーチ率を分析したところ、大きな違いが見られました。
戦略的な戦術とストーリーズのリーチ数を増やす方法
- 1日に最低6本以上のストーリーズを投稿して、認知度を高めましょう。 1~3枚で終わるストーリーズでは、リーチを最大化できません。認知度アップが目標なら、毎日6枚以上のスライド投稿を始めてください。画期的なコンテンツは不要です。商品アップ、ミニQ&A、テストモニアルや簡単なアンケートなどでOKです。バリエーションを持たせて、継続的に発信しましょう。
- 日々のフローを見直し、成果の低いパターンを改善しましょう。 どのシーケンスで離脱が多いか確認してください。スライド5以前でユーザーが離脱していますか?フックを見直しましょう。最後の数枚の成果が悪い場合は、スライド数を減らしてください。その後、短く集中したアークで再テストし、1週間リーチの変化を追跡しましょう。
- スライド14枚目の前で止めてください。ただし、本当に必要な場合を除きます。2025年には、スライド13枚目以降からリーチが下がり始めます。習慣でストーリーズを14枚や15枚投稿している場合は、12枚まで減らしてリーチを比較しましょう。大きなキャンペーンや重要なストーリーの場合だけ長いシークエンスを使い、メリハリを意識してください。
- フォーマットを多様化し、リーチ低下に対策しましょう。静止画スライドだけでは、動画の持つ追加効果を逃す可能性があります。1〜2枚でも動画スライドを加えることで、ストーリーズでより多くリーチを伸ばせます。
- フィード投稿でオーディエンスにリーチしましょう——ストーリーズで維持しましょう。フィードコンテンツは、今や主要なリーチエンジンです。見てもらいたい場合は、投稿、リール、カルーセルを活用してください。フォローやエンゲージメントがあったら、ストーリーズで信頼を築き、交流を促し、行動につなげます。
Instagramストーリーズインプレッションのベンチマーク
リーチがストーリーを見た人を示すなら、インプレッションは残った人、または何度も見返した人を示します。ここで、本当の関心度を測れます。あなたのコンテンツは、思わず立ち止まるほどエンゲージメントを生んでいますか。再視聴されますか。次に進むのではなく、戻って見直されますか。
1. 1日に投稿されるストーリーズ数を基に、2024年から2025年にかけてInstagramストーリーズのインプレッション率がどのように変化したかを見ていきましょう。
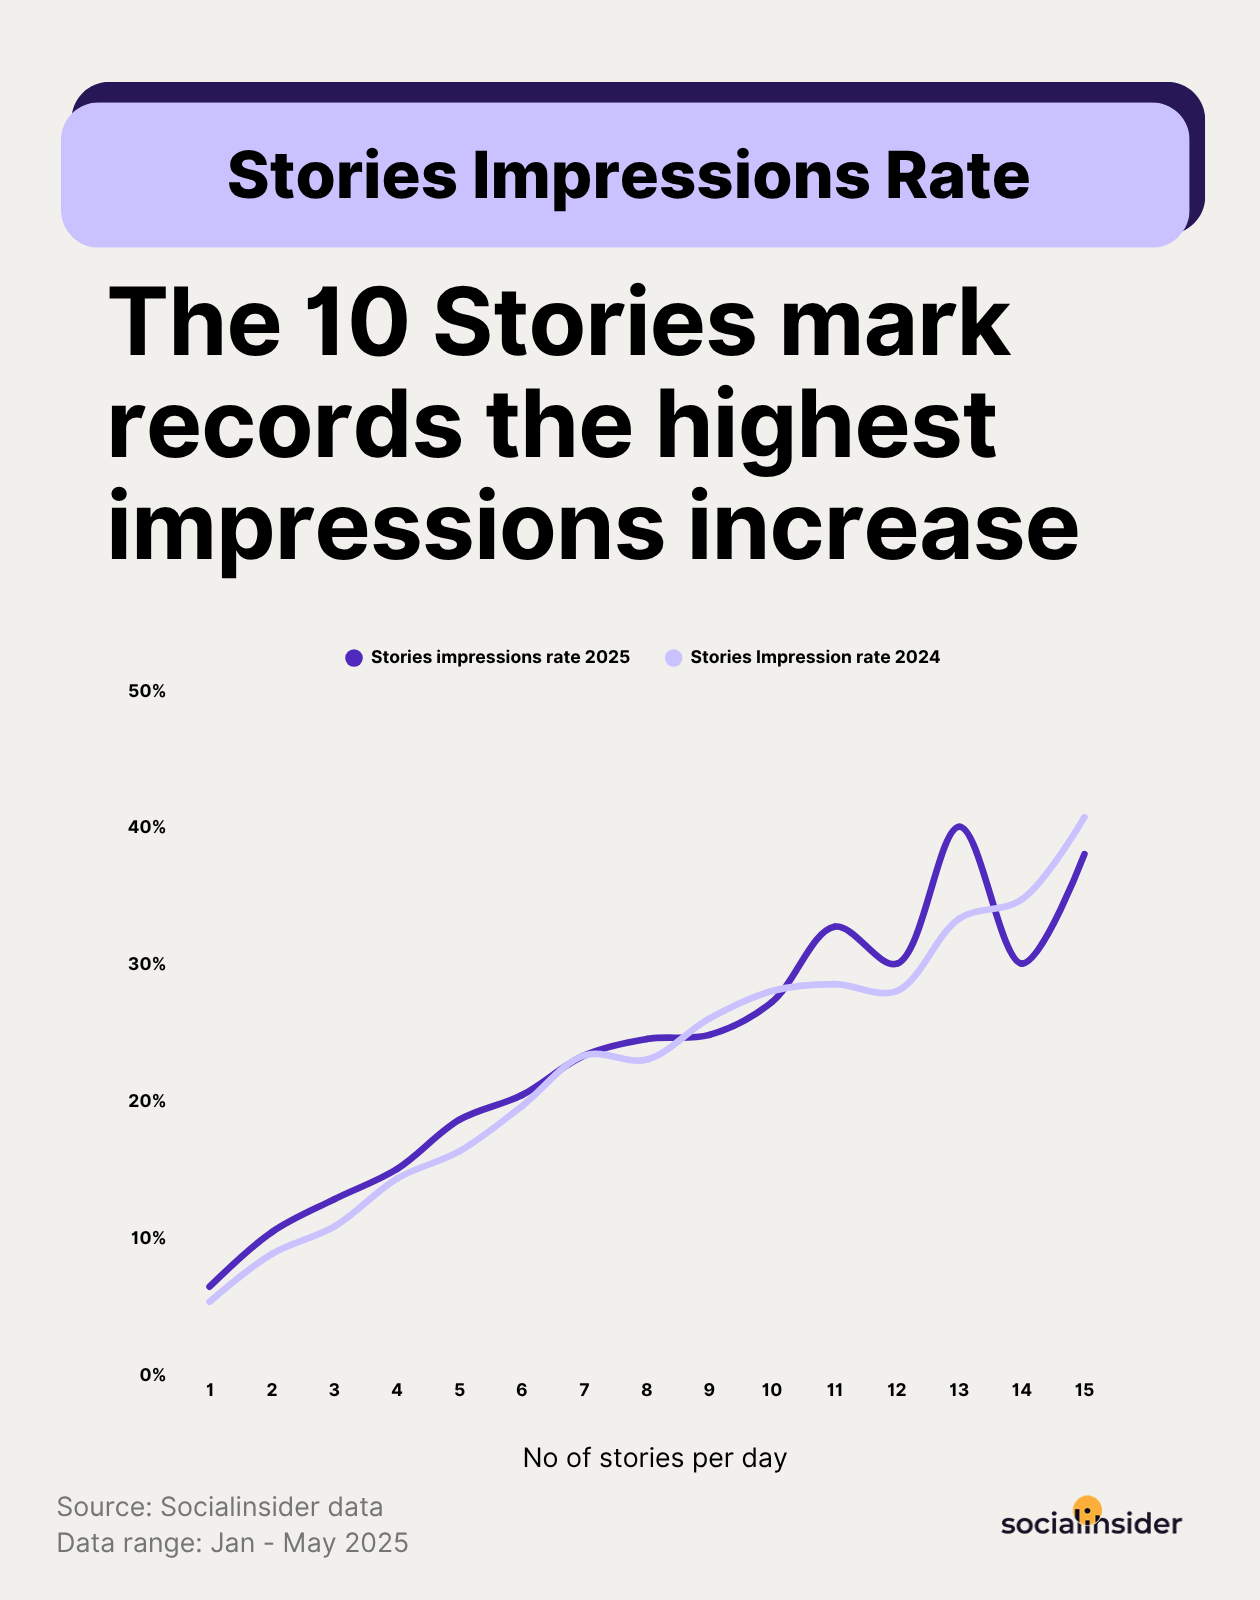
2. 一見すると、2025年は2024年よりも好調に見えます。特に短いシーケンスや中程度のシーケンスでは顕著です。スライド1からスライド6まで、インプレッションは一貫して増加しています。つまり、ユーザーはストーリーズを見るだけでなく、さらに多くのストーリーズとエンゲージメントし、何度も戻ってきています。
3. しかし、その中間点以降はどうでしょうか?
- 4. 2025年はスライド7〜8あたりからインプレッションが横ばいになります。
- スライド9〜10で、実際に2024年よりやや下回っています。
- スライド13で急上昇し、40.0%の新高値を記録します。2024年のどの時点よりも高い数値です。
ここで何が起きているのでしょうか?
注目が圧縮されているようです。しかし成果は一気に現れます。テンポの良いストーリー展開や、最後まで見たくなるストーリーズが評価されています。一方、埋め草やゆっくりした展開には、オーディエンスは厳しい反応です。
Strategic insights to boost your impressions
- CTA slides are your best impression magnets - if placed right.Slides with a clear action ("Reply to vote," "Tap the link," "Send us your thoughts") often get rewatched as users hesitate or come back later. Put these strategically in the middle or toward the end of the sequence—not the very last slide.
- 完了だけでなく、視聴時間を意識したデザインにしましょう。Instagram’s algorithm favors content that holds attention, even across multiple views. That means your visual rhythm matters: alternate fast-paced slides with slower, text-driven moments, or zoom out for context between close-ups. The more time people spend inside your Story, the more likely it is to be resurfaced.
- 視聴者が何度も見るまとめスライドを作成しましょう。 箇条書きのまとめやチェックリスト、価格の内訳などのスライドは便利なので、再視聴されやすいです。リファレンスとして見返すユーザーが多いです。シーケンスの終盤に配置すると、離脱直前のインプレッション率向上につながります。
メソドロジー
この調査結果は、アクティブブランドが2025年1月から5月と2024年1月から5月に投稿した161,180件のInstagramストーリーズを分析したものです。
Theexit rate refers to the percentage of viewers who leave your Story sequence entirely from a specific slide—meaning they swipe away, close the app, or tap out to another account. It is calculated using this formula: number of exits on a slide divided by the total views on a slide and multiplied by 100.
The タップフォワード率 is the percentage of viewers who tap to move to the next Story slide- without exiting or engaging with the current one. It is calculated using this formula: number of forward-taps divided by total views and multiplied by 100.
ストーリーズリーチ率は、ストーリーズのスライドを1枚以上視聴したフォロワーの割合を示します。計算式は「視聴者数 ÷ 総フォロワー数 × 100」です。
ストーリーズインプレッション率は、ストーリーズのスライドがフォロワーに何回表示されたかを示す指標です。計算式は「総インプレッション数 ÷ 総フォロワー数 × 100」です。
Get in-depth Stories performance insights
Instagramストーリーズを徹底分析し、戦略最適化のアイデアを取得しましょう!
リアルタイムのインサイトでソーシャルメディア戦略を強化しませんか?
戦略的なインサイトを獲得し、全チャネルのソーシャルパフォーマンスを分析します。異なる期間のメトリクスを比較し、レポートを数秒でダウンロードできます。