Análisis de Twitter más allá de lo que muestra la plataforma
Un solo dashboard, visión competitiva total. Socialinsider extrae datos de engagement, crecimiento y contenido de cualquier perfil público de Twitter y los compara con los tuyos.


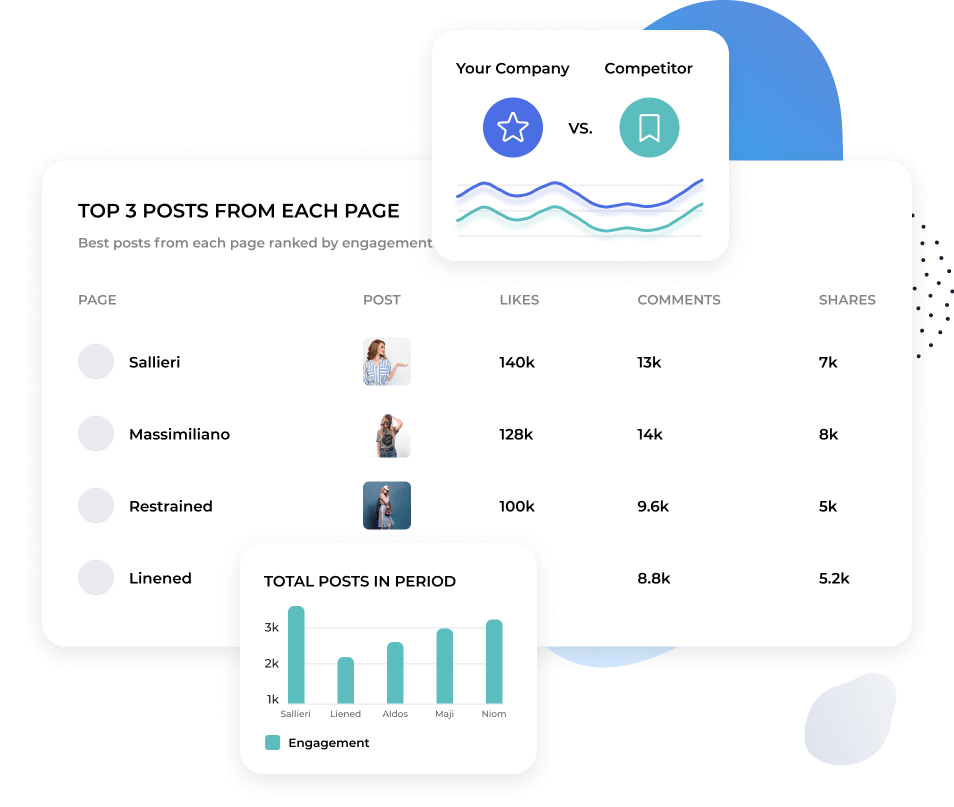
Compara tu perfil de Twitter frente a cualquier competidor
Agrega cualquier perfil público de Twitter y consulta engagement, impresiones, respuestas, retuits y crecimiento de seguidores junto a los de tu cuenta.
No necesitas ir de un perfil a otro ni tomar 100 capturas de pantalla. Todo está en una sola vista para análisis e insights inmediatos.
Entiende qué contenido está funcionando en Twitter
Twitter es rápido. Lo que tiene tracción hoy puede que mañana no.
Socialinsider desglosa el rendimiento del contenido a nivel de publicación y lo agrupa por tema, para que veas qué temas y formatos consiguen engagement de forma consistente, no solo qué publicaciones se hicieron virales.

"Hemos empezado a usar Socialinsider para crear análisis competitivo completos."

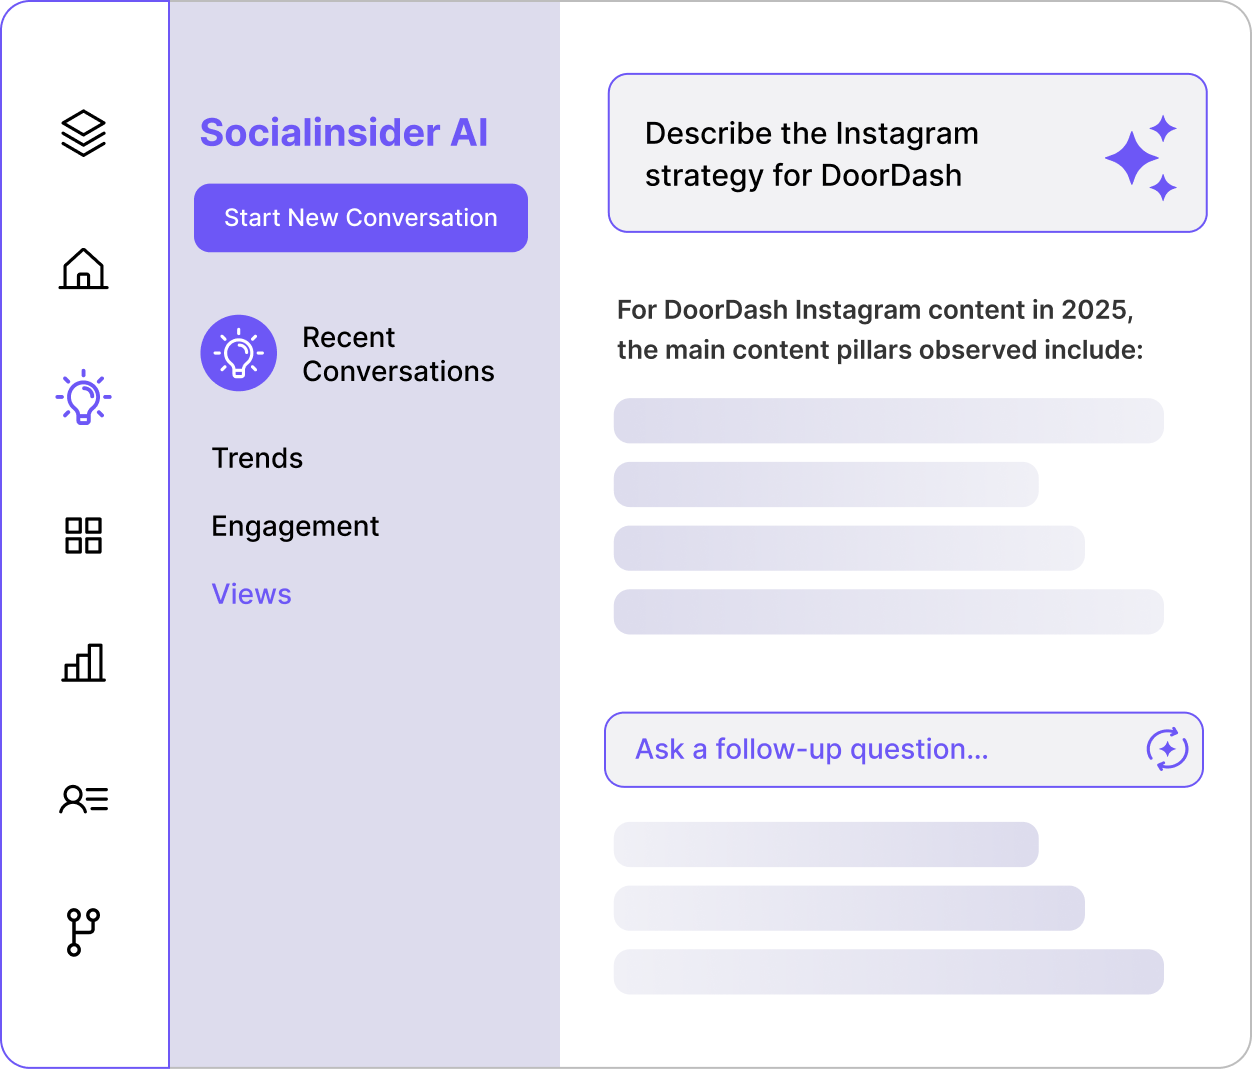
Pregunta a Socialinsider AI qué está pasando en tu perfil de Twitter
Pregunta, por ejemplo: ¿Por qué aumentaron las respuestas la semana pasada? o ¿Cómo se compara nuestra frecuencia de publicación con la de [competidor]?
Socialinsider AI extrae datos de tu Twitter, los de tus competidores y los benchmarks del sector para darte una respuesta escrita que puedes implementar.
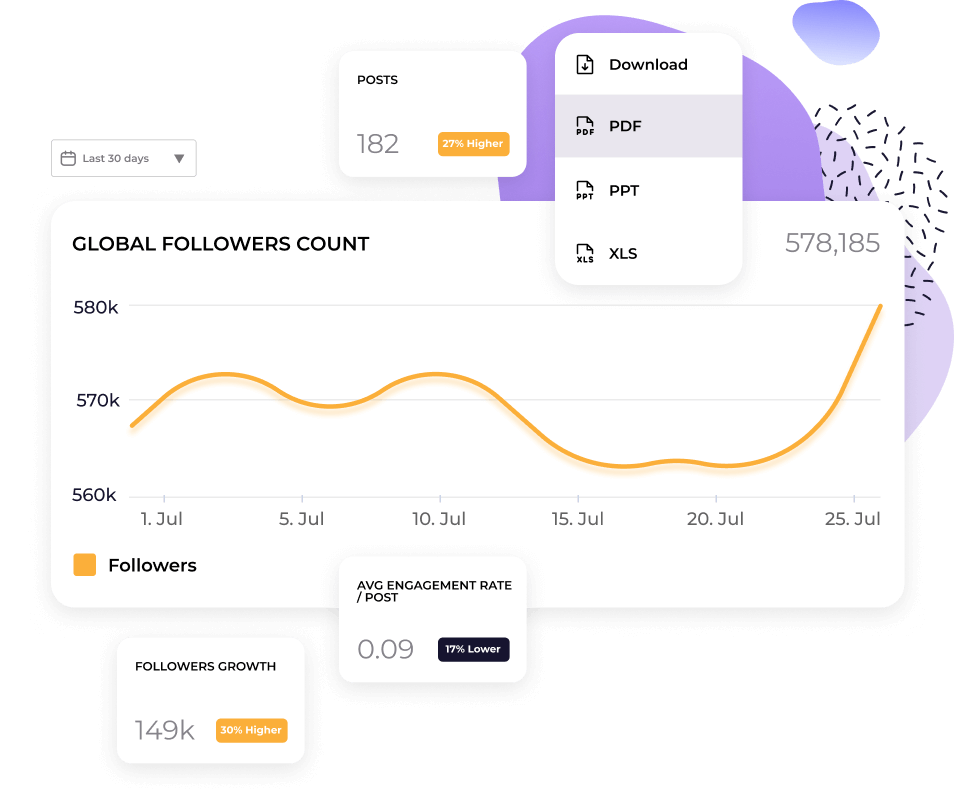
Automatiza los informes de Twitter con reportes listos para presentar
Exporta tus análisis de Twitter a CSV, Excel, PDF o PPT. Conéctate a Looker Studio si tu equipo usa dashboards allí.
Los informes salen formateados y con tu marca para que no tengas que pasar la tarde rehaciendo una presentación cada mes.
Lo que dicen sobre nosotros
"El servicio de atención al cliente también ha sido una de mis funciones favoritas. Sois fenomenales. Tu equipo es muy receptivo, amable y servicial. Lo cual no es lo habitual."

"Socialinsider nos ayudó a entender si estamos mejorando o disminuyendo, especialmente en comparación con otras cuentas que seguimos."

"Socialinsider permite un análisis competitivo que ofrece una visión del rendimiento en relación con el mercado."

"El análisis de sentimiento es increíble para los hashtags de Instagram. Este nuevo dashboard de escucha en redes sociales me ayudó en la planificación a largo plazo."

"Estamos usando este dashboard de análisis de redes sociales para nuestros 40 clientes de redes sociales. Podemos tener todos los datos de rendimiento en un solo lugar."

"Con Socialinsider, nuestro equipo se volvió más eficiente. Ya no necesitamos dedicar tiempo a recopilar datos de redes sociales. En su lugar, podemos centrarnos en insights y análisis."

"Usamos Socialinsider para insights diarios de redes sociales si necesitas definir cambios estratégicos simples o revisar el rendimiento de ciertas publicaciones sociales."

"En promedio, un informe de redes sociales para una marca requiere de 1 a 2 horas de trabajo con Socialinsider, cuando antes se tardaba un día entero en recopilar los datos."

"Socialinsider nos ha ahorrado más de 16 000 $ al año. Nos ha permitido ahorrar tiempo en informes mensuales y análisis complejos a largo plazo."

Cómo seguir la tasa de engagement de Twitter en Socialinsider
Las analíticas de redes sociales y las herramientas de análisis competitivo de Socialinsider te permiten medir el rendimiento en redes sociales, realizar auditorías y comparar resultados.
Empieza creando una cuenta de prueba en Socialinsider.
Añade a tus competidores y conecta los perfiles que gestionas.
Obtén todas las métricas de engagement para cualquier cuenta empresarial de Twitter.
Compara tu rendimiento con el de tus principales competidores.
Realiza un análisis multicanal para evaluar tu desempeño en Twitter.

Obtén inteligencia competitiva y explora
métricas de análisis en redes sociales
Preguntas frecuentes
¿Tienes una pregunta? Tenemos respuestas.
¿Qué son las analíticas de Twitter?
El análisis de X (Twitter) consiste en recopilar y analizar datos de tu cuenta de X para evaluar y optimizar tu estrategia y presencia en la plataforma.
Puedes obtener varias métricas de tus datos de Twitter, pero generalmente se dividen en tres categorías:
- Audiencia: por ejemplo, crecimiento de seguidores, datos demográficos y horas de mayor actividad.
- Contenido: por ejemplo, impresiones de Tweets, visualizaciones de videos, engagement, tasas de engagement y clics en enlaces.
- Rendimiento de campañas: por ejemplo, costo por engagement, tasas de conversión y retorno de la inversión publicitaria (ROAS).
Puedes monitorear tu actividad en Twitter usando las analíticas nativas de Twitter (pero atención: solo están disponibles con un plan X premium de pago) o con una herramienta externa como Socialinsider.
Rastrear e interpretar correctamente tus datos de análisis es fundamental para cualquier estrategia exitosa de marketing en Twitter. Las insights de Twitter te ayudarán a:
- Realizar una auditoría de Twitter: con una visión integral de toda tu actividad en Twitter, puedes identificar rápidamente qué funciona y qué no—sin perder tiempo ni presupuesto en tácticas que no cumplen tus objetivos de negocio.
- Medir el rendimiento del contenido: al entender qué contenido obtiene más visualizaciones, impresiones, me gusta, respuestas o retweets, puedes adaptar futuras publicaciones para mejorar resultados.
- Analizar el crecimiento del perfil: rastrear las visitas y seguidores de tu perfil te mostrará si tu contenido está generando un crecimiento real de la página.
- Identificar tendencias: en tu audiencia, sector y la plataforma en general, para mantenerte al día con las conversaciones aceleradas por las que Twitter es famoso.
- Exportar datos para informes y medición del ROI: controla de cerca cómo se traduce el gasto y los recursos en ROI. Exporta datos desde las analíticas de Twitter para crear informes claros y accionables para ti y los directivos de la empresa.
Por qué es importante rastrear las analíticas de X (Twitter).
Si usas redes sociales en tu estrategia de marketing, necesitas familiarizarte mucho con las analíticas de redes sociales. Esto es especialmente importante para Twitter.
Primero, la naturaleza misma de Twitter es… algo abrumadora. Con más de 300 millones de usuarios, un alto volumen de Tweets y conversaciones que se mueven a gran velocidad, podrías preguntarte si realmente es posible destacar entre el ruido.
En segundo lugar, Twitter ha experimentado grandes cambios desde su adquisición por Elon Musk en 2022—y no solo en el cambio de nombre a X:
- Funciones y funcionalidades: Musk ha declarado que imagina X como una “app para todo”. Esto significa que constantemente se añaden nuevas funciones y características a la plataforma, desde compras hasta cuentas X Premium y reparto de ingresos publicitarios.
- Contenido más diverso: Antes conocido por sus Tweets cortos de 140 caracteres, X ha aumentado el límite de caracteres para que los usuarios de pago publiquen textos más largos, además de introducir más contenido multimedia.
- Crecimiento de la audiencia: En total, X ha perdido unos 32,7 millones de usuarios desde la adquisición. Pero si profundizamos en los datos demográficos, vemos un aumento de usuarios de la Generación Z (el 45% de la Gen Z usa X).
Cómo pueden las marcas usar las analíticas de Twitter.
Las marcas han usado históricamente Twitter para divertirse y comunicarse en tiempo real con su audiencia (piensa en marcas de comida rápida como KFC o Wendy’s). Sin embargo, todos estos cambios pueden hacerte cuestionar si X aún vale la pena.
Por eso las analíticas de Twitter son más importantes que nunca: te ayudarán a responder esa pregunta. Podrás:
- Obtener inteligencia competitiva - monitoriza otros perfiles y la actividad en Twitter en tu sector para encontrar tu ventaja competitiva: ¿otras marcas de tu nicho tienen éxito? ¿Cuáles son los temas más importantes de conversación? ¿Tu categoría está saturada o existen oportunidades que puedes aprovechar? Todo esto te indicará si vale la pena mantener presencia en X.
- Ofrecer una mejor experiencia al cliente - toda buena estrategia de marketing comienza entendiendo a tu audiencia. Las analíticas de seguidores en Twitter te mostrarán los datos demográficos de quienes atraes (o quieres atraer), para que puedas incorporar sus necesidades y preferencias en cada tweet y campaña. Y no es solo contenido: recuerda que X es un canal clave para soporte al cliente en tiempo real.
- Entender tendencias y patrones - Twitter no solo es muy impulsado por tendencias, sino también extremadamente rápido. Con discusiones sobre noticias o eventos sucediendo en tiempo real, las analíticas te ayudan a monitorizar conversaciones emergentes, identificar patrones estacionales y comprender el comportamiento de tu audiencia para seguir siendo relevante, adaptar y aprovechar momentos clave para tu marca.
- Identificar el mejor contenido - Los tweets siguen limitados a 280 caracteres para usuarios sin pago, pero los usuarios pagos pueden publicar hasta 4.000 caracteres. Aun así, las costumbres cambian lento: el tweet promedio tiene entre 240 y 259 caracteres, y se recomienda publicar de 5 a 10 veces al día. Dada la limitación de espacio y alta frecuencia de publicación, necesitas recursos, mensajes claros y una voz de marca distintiva para lograrlo. Seguir tus esfuerzos en Twitter te ayudará a identificar las publicaciones y formatos de mayor rendimiento (por ejemplo, video vs. texto), optimizar tu producción de contenido y mejorar resultados.
- Conseguir influencers y defensores de X (Twitter) - en cuanto a aumentar visibilidad, incrementar engagement y generar confianza con tu audiencia, asociarte con influencers y defensores de X puede marcar la diferencia. Las analíticas de Twitter te ayudan a identificar seguidores que interactúan con frecuencia y a detectar líderes de opinión y creadores populares en tu nicho. Ya sea que realices sorteos, organices AMAs o colabores en tweets promocionados, luego puedes usar las analíticas para reportar el éxito de la colaboración.
Cómo consultar las analíticas de Twitter
Ahora que entiendes por qué es tan importante contar con analíticas robustas de Twitter, te preguntarás cómo ver tus analíticas.
Para empezar, las analíticas nativas de Twitter solo están disponibles con una suscripción paga a X Premium. Así que si tienes una membresía gratuita o la suscripción Básica de X, no podrás acceder a tu dashboard de analíticas en la aplicación.
La buena noticia es que puedes usar una herramienta externa, como Socialinsider, para hacer análisis avanzados sin pagar la suscripción a X.
Aquí tienes una guía rápida sobre cómo acceder a las analíticas de Twitter en X desde el móvil, el escritorio y Socialinsider.
Cómo ver las analíticas de X (Twitter) en el móvil
- Abre la app de X (Twitter) e inicia sesión en tu cuenta.
- Toca tu foto de perfil para ir a tu página.
- Busca el tweet específico que quieres analizar.
- Toca el icono "•••" (Más) debajo del tweet y selecciona "Ver analíticas del tweet" para ver datos detallados de engagement, como impresiones, me gusta y retweets.
La versión móvil de las analíticas de X (Twitter) es bastante útil para revisar el rendimiento de los tweets al instante. Sin embargo, necesitarás la versión de escritorio para ver analíticas completas de la cuenta.
Cómo ver las analíticas de X (Twitter) en el escritorio
- Ve a X.com o twitter.com e inicia sesión en tu cuenta.
- Haz clic en "Más y Creator Studio" en el menú de la izquierda, donde encontrarás tu dashboard de analíticas de X.
- Podrás ver un resumen del rendimiento de tu cuenta, incluyendo:
- Resumen de 28 días de impresiones, visitas al perfil, menciones y seguidores
- Destacados como los mejores tweets, mejores menciones y mejores seguidores
- Actividad de tweets y videos: métricas más detalladas como impresiones, visualizaciones y engagement
- Seguimiento de conversiones para campañas publicitarias
También puedes explorar datos demográficos de la audiencia (edad, ubicación, horas activas, etc.) y tendencias de contenido a lo largo del tiempo.
Cómo ver las analíticas de X (Twitter) con Socialinsider
Más allá del dashboard nativo, las herramientas de análisis de Twitter como Socialinsider pueden brindarte insights más potentes para destacar en X.
Si quieres entender analíticas a largo plazo, monitorizar KPIs relevantes en un dashboard de Twitter fácil de leer, acceder a datos competitivos y benchmark de sector, y automatizar tus informes—todo sin pagar por una suscripción X—vale la pena que lo pruebes.
Así puedes ver las analíticas de Twitter con Socialinsider:
- Crea una cuenta en Socialinsider o inicia sesión.
- Crea un nuevo proyecto o accede a uno existente. Haz clic en "Conectar cuentas sociales".
- Conecta tu cuenta de X (Twitter) y luego selecciona las páginas que quieras agregar.
- Desde tu dashboard, puedes seleccionar la plataforma y la página que deseas analizar.
- Aquí puedes acceder a una amplia gama de analíticas avanzadas: desde las herramientas de análisis competitivo de Twitter de Socialinsider hasta datos históricos de analíticas para tus tweets.
Todas las métricas de X (Twitter) que debes conocer
X no solo es una plataforma de redes sociales muy única, sino que también ha experimentado cambios importantes. Por eso, no puedes simplemente copiar y pegar tu estrategia de informes de Instagram o Tik Tok: necesitas comprender bien qué métricas de análisis de Twitter debes seguir.
Pero antes de empezar a hacer seguimiento, aclara primero tus objetivos. Tus indicadores clave de rendimiento (KPI) dependerán de los objetivos empresariales, pero X suele ser mejor para:
- Hacer crecer tu audiencia e incrementar el reconocimiento de marca
- Impulsar el engagement y cultivar una comunidad
- Dirigir tráfico al sitio web
- Ventas directas
- Liderazgo de pensamiento
- Investigación de clientes y social listening
En términos generales, las métricas más importantes que debes seguir son las métricas generales, métricas de audiencia y métricas de contenido. Vamos a desglosar cada área y a comprender cómo cada métrica aporta al panorama general.
Métricas generales
La rapidez de X significa que sí necesitas seguir el rendimiento en tiempo real. Aquí es donde entran las métricas generales, ya que te permiten consultar todos tus KPI de un vistazo.
Con este resumen de alto nivel de las analíticas de tu cuenta de Twitter, puedes determinar la efectividad general de tu estrategia y detectar rápidamente patrones de rendimiento.
Las métricas generales incluyen:
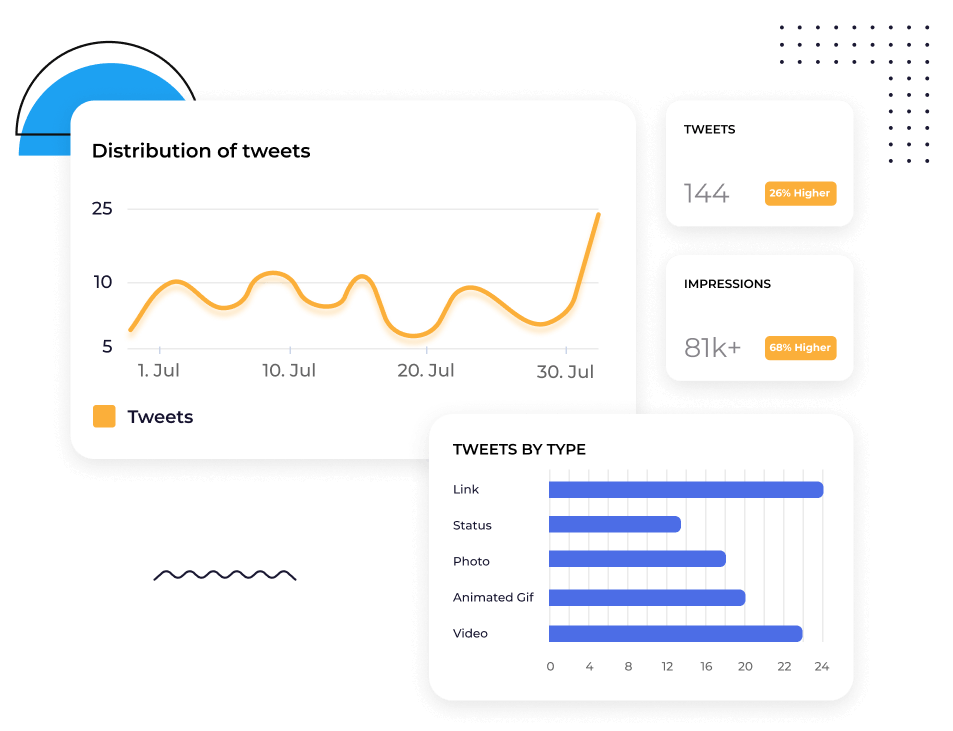
Impresiones (clasifica con Socialinsider) - el número total de veces que se ha visto tu tweet, incluidas varias visualizaciones de un mismo usuario. Hacer seguimiento de las impresiones te ayuda a medir el alcance de tu contenido y la visibilidad de marca en X.
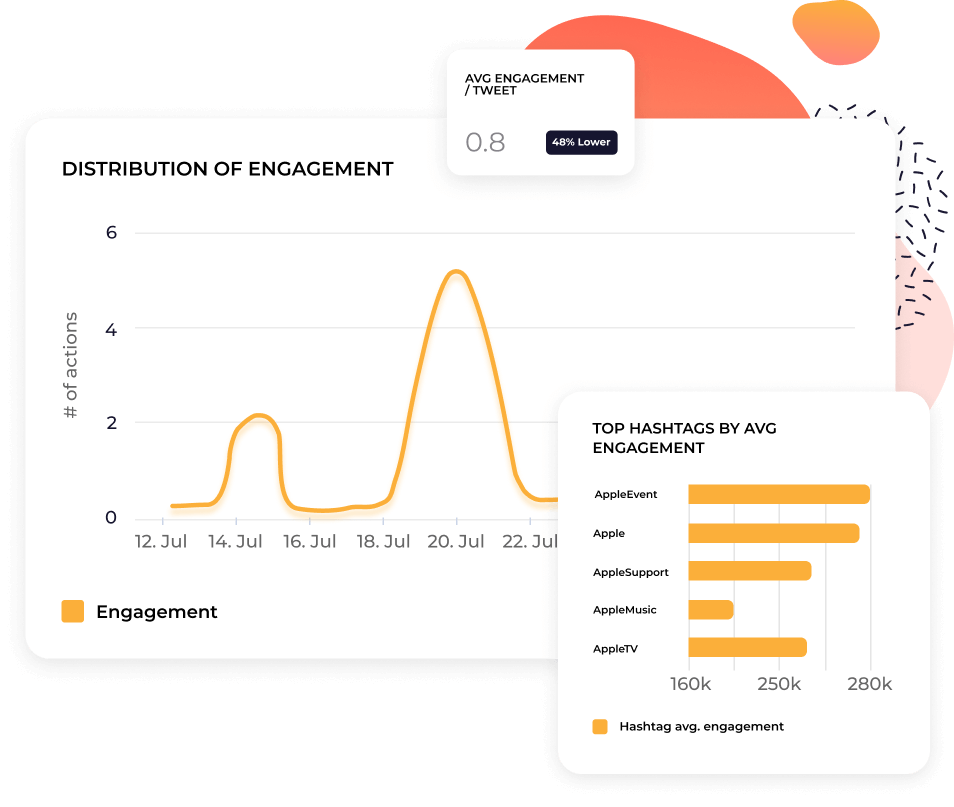
Engagement (clasifica con Socialinsider) - el número total de interacciones en un tweet, incluyendo me gusta, respuestas, retweets y clics en enlaces, hashtags o medios. Esto te permite saber si tu contenido conecta con tu audiencia. Además, un alto engagement impulsa la visibilidad en el algoritmo de X.
Tasa de engagement (clasifica con Socialinsider) - el porcentaje de usuarios que han interactuado con un Tweet, respecto al total de usuarios que lo han visto. Puedes calcularlo sumando todas las interacciones, dividiendo ese número entre las impresiones del tweet o el total de seguidores, y multiplicando por 100 para obtener el porcentaje. Como las fluctuaciones de visibilidad pueden estar fuera de tu control (por ejemplo, por una actualización del algoritmo), la tasa de engagement es una forma útil de medir la calidad del engagement, no solo su cantidad.
Visitas al perfil (clasifica en la app nativa) - cuántas veces los usuarios hacen clic para visitar tu perfil. Monitorear las visitas al perfil es útil para medir cómo tu contenido genera interés en tu marca y si la gente busca activamente tu cuenta. Básicamente, ¿la gente quiere saber más de ti?
Nuevos seguidores (clasifica con Socialinsider) - cuántos seguidores nuevos has conseguido en un periodo específico. Esto muestra si tu contenido y campañas impulsan el crecimiento de tu audiencia. Si ganas seguidores, indica que la gente quiere tener una relación continua con tu marca—tal vez les gustó un tweet y ahora quieren ver tus próximas publicaciones.
Respuestas (clasifica con Socialinsider) - el número de respuestas directas a tu tweet. Las respuestas indican que tu contenido genera conversación, que es el objetivo real de Twitter. Son útiles para aumentar el engagement (ya que el algoritmo de X prioriza el contenido con mucho ruido) y para cultivar tu comunidad (por ejemplo, fomentar la conexión o recopilar feedback).
Me gusta (clasifica con Socialinsider) - el número de me gusta que recibe un Tweet. Los me gusta son la forma más fácil de que tu audiencia interactúe con tu contenido, lo que los convierte en un indicador rápido de si tu contenido está recibiendo aprobación.
Reposts (clasifica con Socialinsider) - el número de veces que tu tweet se re-publica o “retuitea”. Si alguien te retuitea, significa que se identifica con tu contenido y considera que es lo bastante valioso para compartirlo. Así que diseñando tu contenido para que sea compartible, puedes amplificarlo a una audiencia más amplia.
Marcadores (clasifica en la app nativa) - cuántas veces los usuarios han guardado tus tweets. Una vez más, los marcadores son una métrica importante basada en el valor: aunque alguien no interactúe públicamente con tu contenido, el hecho de guardarlo indica que le resultó interesante y relevante para visitar más adelante.
Compartidos (clasifica con Socialinsider) - el número de veces que tu contenido se ha compartido, tanto dentro como fuera de X. Esto incluye reposts o retweets, además de compartidos externos fuera de X (por ejemplo, vía WhatsApp o correo electrónico). Así puedes ver hasta dónde se difunde tu mensaje más allá de tu audiencia inmediata.
Citas (clasifica con Socialinsider) - el número de veces que tu tweet es re-publicado con un comentario adicional. Cuando los usuarios citan tu tweet, interactúan más intensamente con tu contenido compartiendo sus propias ideas u opiniones. En otras palabras, tu contenido no solo es interesante o valioso, sino también estimulante.
Crecimiento de seguidores (clasifica con Socialinsider) - la tasa a la que tus seguidores totales aumentan o disminuyen con el tiempo. Es esencial analizar tus seguidores de Twitter para comprender el estado general de tu presencia en X y monitorear el impacto a largo plazo de tu contenido.
Métricas de audiencia
En última instancia, tu estrategia en X—desde el tipo de contenido que creas, hasta los KPI que sigues—dependerá de tu audiencia específica. ¿Prefieren vídeos o enlaces a artículos? ¿Les entretienen o confunden los memes? ¿Cuándo es más probable que vean tu contenido? Rastrear métricas de audiencia puede ayudarte a responder todo esto y más.
Edad (clasifica en la app nativa) - los rangos de edad predominantes de tus seguidores. Si conoces los datos demográficos de edad a los que te diriges, puedes asegurarte de que se alinean con tu audiencia objetivo, adaptar tu contenido a sus intereses y preferencias, y afinar tu mensaje para que impacte en los grupos correctos.
Género (clasifica en la app nativa) - la distribución por género de tus seguidores. De nuevo, esto te ayuda a evaluar si tu estrategia va por buen camino—ya sea buscando una representación equilibrada o apuntando a un género específico—y a optimizar tu contenido y campañas publicitarias en consecuencia.
Horarios de actividad (clasifica en la app nativa) - los horarios o días de mayor actividad de tu audiencia en X. Como los tweets son más efímeros que otro tipo de contenidos en redes sociales, querrás publicar cuando tus seguidores estén conectados—tener estos datos te ayuda a ajustar tu calendario.
País (clasifica en la app nativa) - las principales ubicaciones geográficas de tus seguidores. Saber dónde están tus seguidores es esencial para la segmentación publicitaria, pero también para ser sensible a las preferencias culturales y adaptar el contenido o campañas a una audiencia global o local.
Métricas de contenido
Para algunas empresas basta con usar X para social listening o atención al cliente. Pero si quieres construir una presencia que realmente impacte en tus resultados, necesitas invertir en contenido. Y si vas a invertir en contenido, tienes que entender las métricas de contenido.
Estas son las métricas que debes seguir para crear una estrategia de contenido ganadora en X:
Pilares de contenido con IA (clasifica con Socialinsider) - usando IA, Socialinsider puede identificar los temas clave o categorías para construir tu contenido. Estos son los llamados “pilares de contenido”. Te ayudan a enfocar y organizar la creación de contenido, para invertir en publicaciones que más llegan a tu audiencia. En Socialinsider puedes ver tanto el volumen de contenido como las tasas de engagement en diferentes categorías.
Engagement para cada pilar de contenido (clasifica con Socialinsider) - mide qué tan bien funcionan los diferentes pilares de contenido observando likes, respuestas, retweets, citas, compartidos, clics, etc. Al identificar los temas que generan más interacciones, puedes crear nuevo contenido con mayor seguridad.
Impresiones a nivel de publicación (clasifica con Socialinsider) - número de veces que una publicación individual se ha mostrado en los feeds de los usuarios. Comparar impresiones en las analíticas de tweets individuales te mostrará qué impulsa específicamente el alcance de tu página (mensaje, tipo de publicación, promociones pagadas, etc.).
Me gusta a nivel de publicación (clasifica con Socialinsider) - número de me gusta en una publicación individual. Esto te indica qué contenido conecta mejor con tu audiencia.
Respuestas a nivel de publicación (clasifica con Socialinsider) - número de respuestas o comentarios en una publicación individual. Así descubrirás qué tipo de contenido genera engagement más profundo al crear conversaciones.
Reposts a nivel de publicación (clasifica con Socialinsider) - número de veces que una publicación ha sido re-publicada o retuiteada; es decir, cuán compartible es tu contenido. Al monitorear esto con el tiempo, sabrás qué motiva a la gente a compartir.
Tasa de engagement a nivel de publicación (clasifica con Socialinsider) - porcentaje de personas que interactuaron con una publicación individual, de entre las que la vieron (impresiones o seguidores). Esto te ayuda a identificar tus publicaciones más efectivas. Por ejemplo, si dos publicaciones tienen el mismo engagement pero diferentes impresiones, sobresale la de mayor tasa de engagement.
Tipos de publicación por engagement (clasifica con Socialinsider) - desglose de engagement según el tipo de contenido: enlaces, publicaciones de texto, fotos, GIFs animados o vídeos. Muy útil para detectar fácilmente qué formatos funcionan mejor, para crear más de lo que realmente engancha a tu audiencia.
Publicaciones con más engagement (clasifica con Socialinsider) - un ranking de publicaciones con los niveles más altos de engagement. Clasificar el rendimiento te ayudará a replicar y mejorar acciones o contenidos exitosos, para alcanzar nuevos récords de engagement.
Publicaciones con menos engagement (clasifica con Socialinsider) - las publicaciones con los niveles más bajos de engagement. Tan importante como rastrear los mejores, así sabrás qué dejar de hacer y evitarás perder tiempo, recursos o presupuesto en contenido que no genera resultados relevantes.
Cómo crear informes de análisis de X (Twitter).
Creating detailed X (Twitter) analytics reports is helpful for you, the rest of your team, and company stakeholders. They’ll help you:
- Track performance to make sure your posts and activity are hitting KPIs
- Identify patterns and trends to refine your content creation efforts
- Gather helpful intel on your audience and competitors
- Communicate how your Twitter marketing is supporting wider business objectives
You can create Twitter reports in various formats by following the steps below.
a) CSV reports - create with SocialinsiderWith Socialinsider, you can export any data you see in your dashboard. Whether it’s a profile overview or top-performing posts, just look out for the “Download” button in the top-right corner.
When you click this, you’ll see a dropdown menu with different formats. Select CSV to export your data, which you can then import into Microsoft Excel or Google Sheets (note that only certain reports can be exported as CSVs).
b) PPT, PDF or Excel reports - create with SocialinsiderTo export your Socialinsider data into PPT, PDF or Excel reports, simply follow the same steps as above, but select a different format from the dropdown menu.
You can also automate reporting to get your favorite reports sent straight to your inbox. Just head to the “Autoreports” section in the left hand sidebar and start scheduling.
c) Looker studio - create with GoogleIf you’re working with a lot of data (for example, across multiple profiles, channels or brands), you might wish to use Google’s Looker studio (formerly Google Data Studio). Looker is a data visualization platform that can help you present and analyze your Twitter data in a bigger, more sophisticated marketing dashboard.
To pull in your Socialinsider data, log into Google Looker, go to “Data sources” and connect Socialinsider.
Cómo crear informes de análisis competitivo de X (Twitter)
Tu cuenta de Twitter puede ofrecer muchos datos, pero centrarte solo en tus propias métricas no te llevará al éxito en redes sociales. Para mejorar realmente tu estrategia de marketing en Twitter, necesitas mirar hacia afuera, realizando análisis competitivo y benchmarking de forma regular para descubrir qué hacen (o no hacen) tus rivales y líderes del sector. Esto te ayudará a:
- Entender cómo estás rindiendo en comparación con tus competidores.
- Establecer indicadores clave de rendimiento (KPI) y objetivos realistas.
- Mantenerte al día con las conversaciones y tendencias en tu nicho.
- Replicar estrategias exitosas o aprovechar oportunidades que nadie más ha visto.
Por suerte, es fácil consultar las analíticas de Twitter de otra cuenta usando las herramientas de análisis competitivo de Socialinsider. Para cada perfil de Twitter, puedes seguir:
- ¿Qué temas resuenan más con tu audiencia? - Resalta los temas principales que generan engagement en los competidores, para que tomes inspiración para tus propias publicaciones.
- ¿Cómo rinden las publicaciones a lo largo del tiempo? - Sigue y compara el rendimiento de las publicaciones en tu cuenta y en las cuentas de la competencia, para que puedas identificar patrones y entender mejor los descensos o picos—por ejemplo, si hay una actualización del algoritmo que afecta las impresiones de todos.
- Crecimiento de seguidores - Monitoriza la cantidad de seguidores y el ritmo de crecimiento de tus rivales para que puedas ver qué tan rápido crece su audiencia respecto a la tuya. Así, intenta identificar los factores que generan crecimiento, obteniendo insights sobre cómo atraen (o incluso pierden) seguidores y optimiza tu estrategia en consecuencia.
- Pilares de contenido con IA - El análisis impulsado por IA de Socialinsider puede agrupar publicaciones de competidores en pilares específicos, como contenido educativo o noticias de entretenimiento. Al descubrir qué genera engagement en la competencia (o marcas que admires), puedes descifrar su estrategia y mejorar tu propio mix de contenido.
Al analizar todos estos datos competitivos, puedes evaluar con precisión qué funciona o no en tu nicho para tomar decisiones basadas en datos y superar a tus rivales.
¿Qué pasó con las analíticas de X (Twitter)?
Las analíticas de X (antes Twitter) solían ser gratuitas para todos los usuarios de la plataforma. Con los cambios recientes, la página nativa de analíticas de Twitter ahora solo está disponible para los usuarios con suscripción Premium. Si te preguntas cómo ver las analíticas de Twitter ahora, tienes dos opciones:
a) Actualizar a un plan de pago en X (Premium o Premium+)
b) Registrarte en una herramienta de análisis de terceros, como Socialinsider
¿Dónde están las analíticas de X ahora?
X Analytics ahora está detrás de un muro de pago, lo que significa que necesitas una suscripción Premium para acceder a los datos de rendimiento. Alternativamente, puedes obtener reportes avanzados e insights usando una herramienta de terceros como Socialinsider, sin necesidad de actualizar a un plan pago de X.
¿Por qué no puedo ver las analíticas de mi tweet?
Si no puedes ver las analíticas de tus tweets, revisa qué tipo de plan de X tienes. Si es gratis o Básico, ya no puedes acceder a X analytics; tendrás que actualizar a una suscripción Premium o usar una herramienta de terceros como Socialinsider.
¿Dónde están ahora las analíticas de publicaciones en Twitter?
Las analíticas de publicaciones siguen disponibles, pero solo para usuarios Premium. Si ya no las ves, es porque X ha restringido el acceso a las analíticas sin un plan de pago. Alternativamente, puedes usar plataformas de análisis de terceros como Socialinsider para obtener análisis robustos de Twitter, sin necesidad de actualizar.
Obtén la visión completa de los datos de análisis de Twitter
Consulta cómo tu rendimiento en Twitter se compara con la competencia y toma decisiones estratégicas respaldadas por los datos.