プラットフォーム以上のTwitterアナリティクスを提供します。
1つのダッシュボードで競合状況を完全に把握できます。Socialinsiderは、任意の公開Twitterプロフィールからエンゲージメント、成長、コンテンツのデータを取得し、あなたのプロフィールと並べて表示します。


あなたのTwitterプロフィールをあらゆる競合とベンチマークできます
任意の公開Twitterプロフィールを追加し、エンゲージメント、インプレッション、リプライ、リツイート、フォロワー増加を自身のプロフィールと比較できます。
プロフィールを行き来したり、スクリーンショットを大量に取る必要はありません。すべてがひとつのビューで、すぐに分析とインサイトが得られます。
Understand what content is landing on Twitter
Twitter moves fast. What gets traction today might not tomorrow.
Socialinsider breaks down content performance at the post level and groups it by theme, so you can see which topics and formats consistently earn engagement — not just which individual posts went viral.


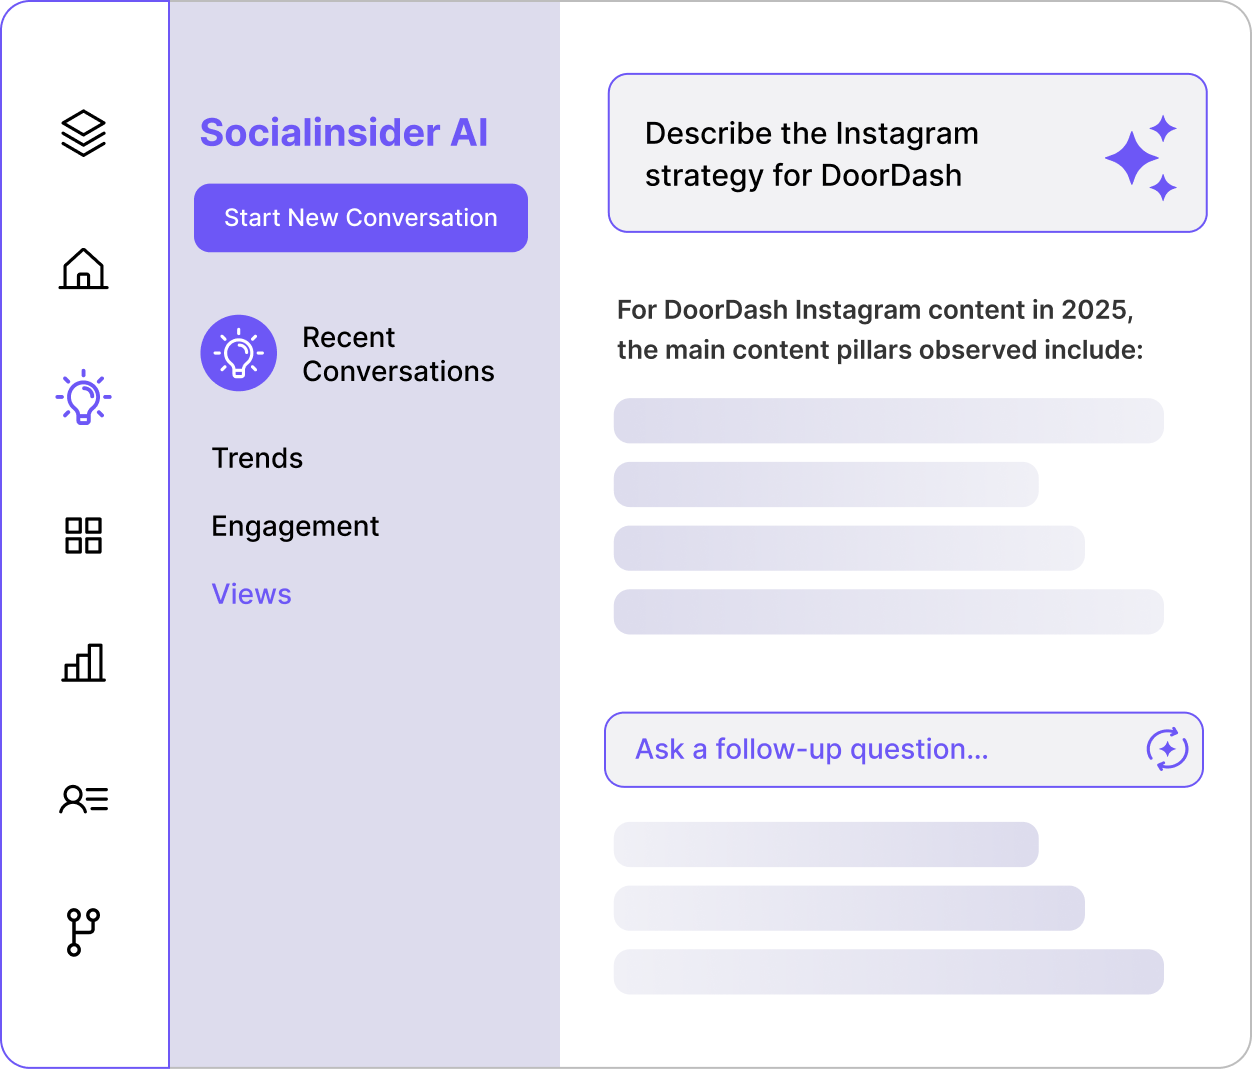
Socialinsider AIにあなたのTwitterプロフィールで何が起きているか聞いてみましょう。
「先週なぜリプライが急増しましたか?」や「当社の投稿頻度は[競合]と比べてどうですか?」のように質問できます。
Socialinsider AIは、あなたのTwitterデータ、競合他社のデータ、業界ベンチマークから情報を取得します。行動につながる具体的な答えを文章でご提供します。
すぐに使えるレポートでTwitterレポーティングを自動化できます
TwitterアナリティクスをCSV、Excel、PDF、PPTにエクスポートできます。チームがダッシュボードを使う場合はLooker Studioとも連携可能です。
レポートはフォーマット済みでブランド化されていますので、毎月プレゼン資料を作り直す手間はありません。
お客様の声
"「カスタマーサービスも私のお気に入りの機能の一つです。皆さんは本当に素晴らしいです。御社のチームはとてもレスポンスが早く、親切で丁寧です。これは普通ではありません。」"

"Socialinsiderのおかげで、私たちが他のフォローしているアカウントと比較して、改善しているのか低下しているのかが明確に分かりました。"

"Socialinsiderでは、競合分析により市場に対するパフォーマンスのインサイトを得ることができます。"

"インスタグラムのハッシュタグに対するセンチメント分析は素晴らしいです。この新しいソーシャルメディアリスニングダッシュボードは、長期的なプランニングにとても役立ちました。"

"私たちは、すべての40社のソーシャルメディアクライアントにこのソーシャルメディアアナリティクスダッシュボードを活用しています。すべてのパフォーマンスデータを一括で管理できます。"

"Socialinsider導入により、チームの効率が向上しました。ソーシャルメディアのデータ収集に時間をかける必要がありません。代わりに、インサイトや分析に集中できます。"

"簡単な戦略変更の計画や特定のソーシャル投稿のパフォーマンスを確認する際、日々のソーシャルメディアインサイトにSocialinsiderを活用しています。"

"平均して、ブランド向けのソーシャルメディアレポート作成はSocialinsiderなら1~2時間で完了します。以前はデータ収集に丸一日かかっていました。"

"Socialinsiderは年間16,000ドル以上のコスト削減に貢献しています。月次レポートや複雑な長期分析にかかる時間も大幅に短縮できました。"

SocialinsiderでTwitterのエンゲージメント率を追跡する方法
Socialinsiderのソーシャルメディアアナリティクスと競合分析ツールで、ソーシャルメディアのパフォーマンスを計測し、監査を実施、成果を比較できます。
まずはSocialinsiderの無料トライアルアカウントを作成してください。
競合他社を追加し、ご自身が管理するプロフィールを連携します
すべてのTwitterビジネスアカウントのエンゲージメントメトリクスを取得できます。
主要な競合他社と自社のパフォーマンスを比較します
クロスチャネル分析でTwitterのパフォーマンスを評価します。

競合のインサイトを取得し、
ソーシャルメディアアナリティクスのメトリクスを確認しましょう。
よくあるご質問
ご質問がありますか?私たちが答えます。
Twitterアナリティクスとは何ですか?
X(Twitter)のアナリティクスとは、自分のXアカウントからデータを収集・分析し、プラットフォーム上の戦略や存在感を評価・最適化することです。
Twitterデータからさまざまなメトリクスを取得できますが、大きく3つのカテゴリに分類されます。
- オーディエンス:たとえばフォロワーの増加、デモグラフィック情報、アクティブな時間帯などです。
- コンテンツ:ツイートのインプレッション、動画の視聴回数、エンゲージメント、エンゲージメント率、リンクのクリック数などです。
- キャンペーンパフォーマンス:エンゲージメント単価、コンバージョン率、広告費用対効果(ROAS)などです。
Twitterのアクティビティは、純正Twitterアナリティクス(注意:これは有料のXプレミアムプランのみ利用可能)またはSocialinsiderのようなサードパーティーツールでモニタリングできます。
アナリティクスデータを効果的に追跡・解釈することは、成功するTwitterマーケティング戦略に不可欠です。Twitterインサイトを活用すると、次のことが可能です。
- Twitter監査の実施:すべてのTwitterアクティビティを包括的に把握し、うまく機能している点・していない点をすぐに特定できます。目標に合わない戦術に時間や予算を無駄にしません。
- コンテンツのパフォーマンス計測:どのコンテンツが最も多くの視聴回数、インプレッション、いいね、返信、リツイートを獲得したかを把握し、今後の投稿に活かしてパフォーマンスを向上させます。
- プロフィール成長の分析:プロフィールへの訪問数やフォロワー数を追跡し、コンテンツが実際にページ成長を促しているかを明らかにできます。
- トレンドの特定:オーディエンス全体、業界、プラットフォーム全体で発生しているトレンドを把握し、Twitterならではのスピーディな会話についていけます。
- レポートやROI測定のためのデータエクスポート:コストやリソースがどのようにROIへ反映されているかを常に確認しましょう。Twitterアナリティクスからデータをエクスポートし、自分や関係者にとってわかりやすく実践的なレポートを作成できます。
X(Twitter)アナリティクスを追跡する重要性
マーケティング戦略にソーシャルメディアを活用している場合、ソーシャルメディアアナリティクスをしっかり理解しておく必要があります。これは特にTwitterに当てはまります。
まず、Twitterの性質自体が…少し圧倒的です。3億人以上のユーザー、高いツイート数、そして高速で動く会話。ノイズを突破するのは可能なのか、と感じるかもしれません。
さらに、Twitterは2022年にElon Muskに買収されてから大きく変化しています。単なる「X」への名称変更だけではありません:
- 機能と特徴 - MuskはXを「何でもアプリ」として考えていると語っています。ショッピングやXプレミアムアカウント、広告収益のシェアまで、常に新しい機能がプラットフォームに追加されています。
- 多様なコンテンツ - 従来は140文字のショートツイートが特徴でしたが、有料ユーザーならテキスト投稿の文字数が拡大し、マルチメディアコンテンツも増えています。
- オーディエンスの成長 - 買収以降、Xは推定3,270万人のユーザーを失いました。しかし、デモグラフィックを掘り下げるとZ世代のユーザーが増加しています(Z世代の45%がXを利用)。
ブランドがTwitterアナリティクスを活用する方法
これまで、多くのブランドはTwitterを活用して、楽しみながらリアルタイムでオーディエンスと交流してきました(KFCやWendy’sのようなファストフードブランドを思い浮かべてください)。しかし、最近の変化により、「X」に投資し続けるべきか迷うこともあるでしょう。
だからこそ、Twitterアナリティクスの重要性がこれまで以上に高まっています。次のことが可能です:
- 競合インテリジェンスを収集 - 業界の他社TwitterプロファイルやTwitterアクティビティをモニタリングし、自社の優位性を把握できます。同じ分野の他ブランドは成果を出しているか?重要な話題は何か?市場は飽和しているか、それともまだ狙い目があるか?これらの分析結果から、「X」で存在感を維持する価値があるか判断できます。
- より良いカスタマーエクスペリエンスを提供 - 優れたマーケティング戦略は、まずオーディエンスの理解から始まります。Twitterフォロワーのアナリティクスで、惹きつけている属性を把握し、ツイートやキャンペーンでニーズと好みを反映させます。コンテンツだけでなく、「X」はリアルタイムのカスタマーサポートにも最適なチャネルです。
- トレンドとパターンを理解 - Twitterは非常にトレンドドリブンでスピーディーなプラットフォームです。ニュースやイベントの話題がリアルタイムで拡がる中、アナリティクスを活用すれば、新しい会話や季節ごとの傾向、オーディエンスの行動を素早く把握し、ブランドの relevancy を維持・適応・活用できます。
- ベストコンテンツの特定 - 無料ユーザーのツイートは280文字ですが、課金ユーザーだと最大4,000文字まで投稿可能です。それでも一般的なツイートは240〜259文字程度、1日5〜10投稿が推奨されています。限られたスペースと高い投稿頻度の中で成果を出すには、十分なリソース、鋭いメッセージ、個性的なブランドボイスが不可欠です。Twitterでの取り組みを追跡することで、成果が高い投稿やフォーマット(例:動画 vs. テキスト)を特定し、コンテンツ制作を最適化し、パフォーマンスを向上できます。
- X(Twitter)インフルエンサーとアドボケイトの獲得 - 可視性の向上、エンゲージメントの増加、オーディエンスとの信頼構築において、Xインフルエンサーやアドボケイトとの連携は大きな成果を生みます。Twitterアナリティクスで、頻繁にエンゲージするフォロワーや人気のオピニオンリーダー・クリエイターを特定可能。プレゼント企画やAMA、プロモーション投稿とのコラボレーションも、アナリティクスでパートナーシップの効果をしっかり検証できます。
Twitterアナリティクスの確認方法
なぜ強力なTwitterアナリティクスが重要なのかご理解いただけたところで、次にX(Twitter)のアナリティクスの確認方法をご紹介します。
まず最初に、Xプレミアムの有料サブスクリプションがないと、ネイティブのTwitterアナリティクスは利用できません。無料メンバーやBasic Xプランの場合、アプリ内のアナリティクスダッシュボードへアクセスできません。
良いお知らせとして、Socialinsiderのようなサードパーティーツールを使えば、Xのサブスクリプションを契約せずに高度なアナリティクスが利用できます。
ここでは、Xモバイルやデスクトップ、さらにSocialinsiderでTwitterアナリティクスへアクセスする方法を簡単にご案内します。
モバイルでのX(Twitter)アナリティクス確認方法
- X(Twitter)アプリを開き、ご自身のアカウントにログインします。
- プロフィール画像をタップし、ご自身のページへ移動します。
- 分析したい特定のツイートを選びます。
- ツイート下の「•••」(その他)アイコンをタップし、「ツイートのアナリティクスを表示」を選択。インプレッション、いいね、リツイートなど詳細なエンゲージメントデータが確認できます。
X(Twitter)のモバイル版アナリティクスは、ツイートのパフォーマンスをその場でチェックするのに便利です。ただし、アカウント全体のアナリティクスにはデスクトップ版の利用が必要です。
デスクトップでのX(Twitter)アナリティクス確認方法
- X.comやtwitter.comへアクセスし、ログインします。
- 左側メニューの「もっと見る」と「Creator Studio」をクリックすると、Xアナリティクスダッシュボードが表示されます。
- アカウントのパフォーマンス概要を確認できます。内容は以下の通りです:
- 28日間のインプレッション、プロフィール閲覧数、メンション、フォロワーのサマリー
- トップツイート、トップメンション、トップフォロワーなどのハイライト
- ツイート・動画パフォーマンス:インプレッション、視聴回数、エンゲージメントなど詳細なコンテンツメトリクス
- 広告キャンペーンのコンバージョントラッキング
また、オーディエンス属性(年齢、地域、アクティブ時間など)や、コンテンツのトレンドも時系列で確認できます。
SocialinsiderでのX(Twitter)アナリティクス確認方法
ネイティブのアナリティクスダッシュボードだけでなく、SocialinsiderのようなTwitterアナリティクスツールを利用することで、さらに高度なインサイトを得られます。
長期的なアナリティクスの把握、分かりやすいTwitterアナリティクスダッシュボードでのKPIトラッキング、競合データや業界のベンチマークへのアクセス、レポート自動化をXのサブスクリプションなしで実現したい場合は、活用をおすすめします。
SocialinsiderでTwitterアナリティクスを表示する手順は以下の通りです:
- Socialinsiderアカウントに新規作成またはログインします。
- 新しいプロジェクトを作成、もしくは既存プロジェクトに移動し、「ソーシャルアカウントを接続」をクリックします。
- X(Twitter)アカウントを接続し、追加したいページを選択します。
- ダッシュボード上で、分析したいプラットフォームとページを選択できます。
- ここから、SocialinsiderのTwitter競合分析ツールやツイートの過去データなど、幅広い高度なアナリティクスにアクセスできます。
知っておきたいX(Twitter)の全メトリクス
Xは非常にユニークなソーシャルメディアプラットフォームであり、大きな変化も経験してきました。そのため、InstagramやTikTokのレポート戦略を単純にコピー&ペーストすることはできません。Xで追跡すべきアナリティクスメトリクスをしっかり理解する必要があります。
ただし、追跡を始める前に、まず目標を明確にしましょう。KPIはビジネス目標によって異なりますが、Xは次のような目的に最適です:
- オーディエンスの拡大とブランド認知度の向上
- エンゲージメントの強化とコミュニティの育成
- ウェブサイトトラフィックの促進
- ダイレクト販売
- オピニオンリーダーの確立
- カスタマーリサーチおよびソーシャルリスニング
全体的に、最も重要なメトリクスは、概要メトリクス、オーディエンスメトリクス、コンテンツメトリクスです。各エリアごとに分解し、それぞれのメトリクスがどう全体像に寄与するのかを見ていきましょう。
概要メトリクス
Xのスピーディな特徴により、パフォーマンスをリアルタイムで追跡する必要があります。ここで概要メトリクスが役立ちます。すべてのKPIを一目でチェックできます。
このハイレベルなTwitterアカウントアナリティクスのサマリーから、戦略の全体的な有効性とパフォーマンスのパターンをすばやく判断できます。
概要メトリクスには次のものがあります:
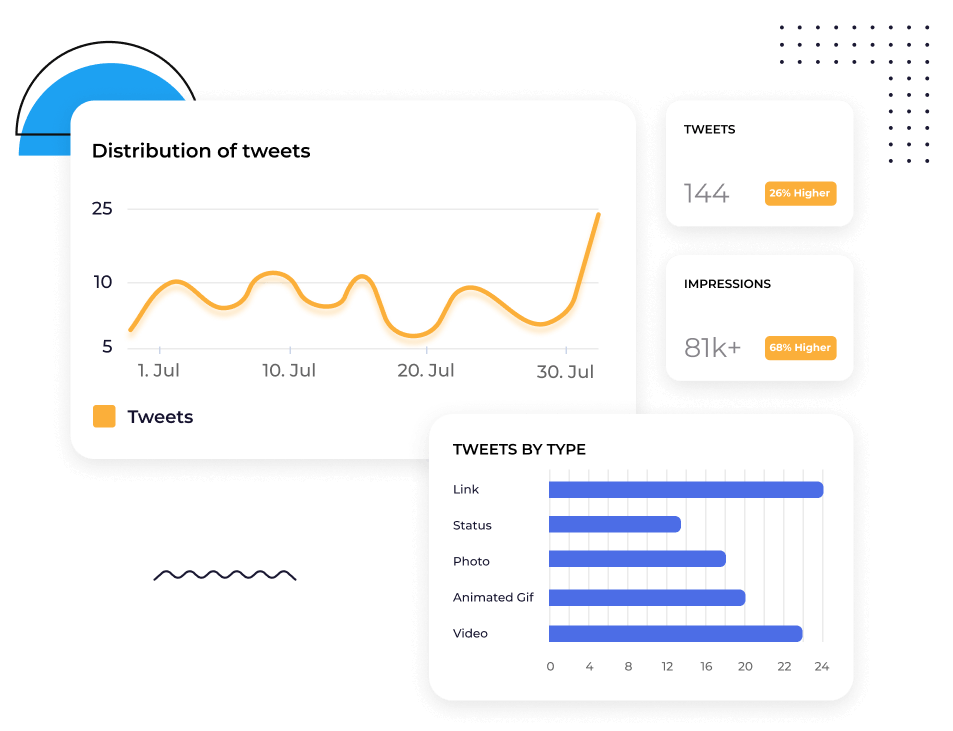
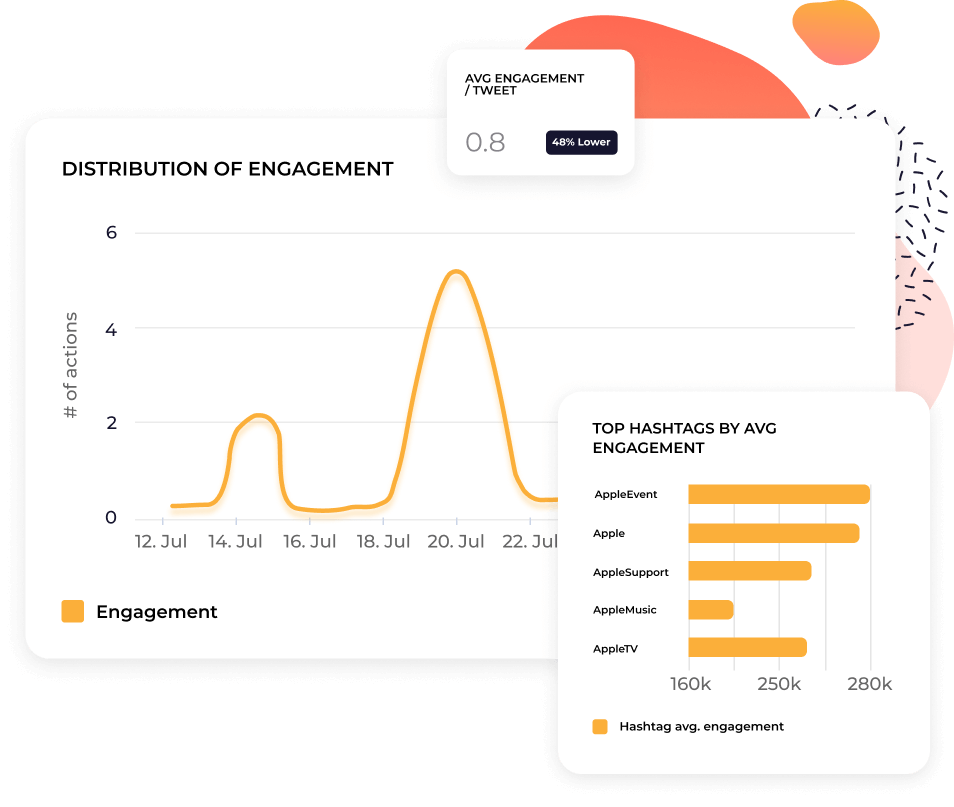
インプレッション(Socialinsiderで追跡) – ツイートが表示された合計回数。同じユーザーによる複数回のビューも含みます。インプレッションを追跡すれば、コンテンツリーチやブランドの可視性が把握できます。
エンゲージメント(Socialinsiderで追跡) – いいね、リプライ、リツイート、リンクやハッシュタグ・メディアのクリックなど、ツイートへの総インタラクション数。コンテンツがオーディエンスに響いているかを把握できます。また、高エンゲージメントはXのアルゴリズムでの可視性向上にもつながります。
エンゲージメント率(Socialinsiderで追跡) – ツイートを見たユーザーのうち、インタラクションしたユーザーの割合。ツイートのエンゲージメント総数を、インプレッション数またはフォロワー数で割り、100を掛けて算出します。アルゴリズムのアップデート等による表示の変動があっても、エンゲージメント率は質を測る有効な指標になります。
プロフィール訪問(ネイティブアプリで追跡) – ユーザーがプロフィールをクリックした回数。プロフィール訪問を追跡すれば、コンテンツがブランドへの関心をどれだけ喚起しているか、ユーザーが積極的にアカウントを調べているかを測れます。要は、あなたについてもっと知りたい人の数です。
新規フォロワー(Socialinsiderで追跡) – 特定期間で増加した新規フォロワー数。コンテンツやキャンペーンがオーディエンス成長に貢献しているかどうかがわかります。フォロワーが増えていれば、ブランドとの関係構築に関心がある証拠です。ツイートを気に入ったユーザーが、次の投稿も見ようとフォローしているかもしれません。
リプライ(Socialinsiderで追跡) – ツイートへのダイレクトな返信数。リプライは会話を生み出している証拠です。Xのアルゴリズムは賑わいのあるコンテンツを優先表示するため、コミュニティ育成やフィードバック収集にも役立ちます。
いいね数(Socialinsiderで追跡) – ツイートが獲得したいいねの数。いいねはオーディエンスが最も手軽にコンテンツに反応できる方法であり、コンテンツへの承認を素早く示します。
リポスト(Socialinsiderで追跡) – ツイートがリポストまたは“リツイート”された回数。誰かにリツイートされると、コンテンツに共感し、フォロワーと共有したい価値があると考えられた証拠です。シェアされやすいコンテンツ設計で、より広いオーディエンスにリーチできます。
ブックマーク(ネイティブアプリで追跡) – ユーザーがツイートを保存した回数。ブックマークは公開されなくても、価値のある指標です。保存は「あとで見返したいほど興味深い・役立った」と感じた証明です。
シェア(Socialinsiderで追跡) – コンテンツがX内外でシェアされた回数。リポストやリツイートに加え、WhatsAppやメールなどで外部シェアされたケースも含みます。自分のメッセージが想定外の範囲まで拡がっているかを把握できます。
引用(Socialinsiderで追跡) – コメント付きでツイートが再投稿された回数。他のユーザーが引用することで、より深くコンテンツと関わり、自分の意見や見解を共有しています。あなたの投稿は関心や価値だけでなく、考えるきっかけにもなっています。
フォロワー増加率(Socialinsiderで追跡) – フォロワー全体が時間とともにどう増減しているか。X上でのプレゼンスの健全性や長期的なインパクトを把握するうえで不可欠です。
オーディエンスメトリクス
最終的に、Xの戦略(作成するコンテンツの種類や追跡するKPI)はオーディエンスごとに異なります。動画派なのか記事リンク派なのか。ミームで楽しむのか困惑するのか。いつコンテンツを目にすることが多いのか。オーディエンスメトリクスを追跡することで、こうした課題に答えられます。
年齢(ネイティブアプリで追跡) – フォロワーの年齢層。ターゲット層とマッチしているかどうかを確かめ、興味や好みに合わせてコンテンツ調整・メッセージを最適化できます。
性別(ネイティブアプリで追跡) – フォロワーの性別比。バランスを狙うのか特定の性別を重視するのか、方針の妥当性を見極め、コンテンツや広告を最適化できます。
アクティブ時間帯(ネイティブアプリで追跡) – オーディエンスがXで最もアクティブな曜日や時間帯。ツイートは他のソーシャルメディアコンテンツより短命なので、フォロワーのオンライン時間を狙うことが重要です。データを活用すれば投稿スケジュールの最適化が可能です。
国(ネイティブアプリで追跡) – フォロワーの主な居住地域。広告のターゲティングはもちろん、文化的嗜好への配慮や、グローバル/ローカル向けのコンテンツ・キャンペーン施策に必須です。
コンテンツメトリクス
一部の企業ではXをソーシャルリスニングやカスタマーサポートに使うだけでも十分です。しかし本気でビジネス成果に直結するプレゼンスを築きたい場合は、コンテンツへの投資が必要です。投資するなら、コンテンツメトリクスの理解も必須です。
Xで勝てるコンテンツ戦略を育てるために追跡すべきメトリクスは以下の通りです:
AIコンテンツピラー(Socialinsiderで追跡) – SocialinsiderではAIを活用し、コンテンツのキーとなるテーマやカテゴリー=“コンテンツピラー”を特定できます。コンテンツ制作を集中・整理し、オーディエンスに響く投稿づくりに投資できます。各カテゴリーの投稿量とエンゲージメント率も可視化できます。
各コンテンツピラーのエンゲージメント(Socialinsiderで追跡) – いいね、リプライ、リツイート、引用、シェア、クリックなどを追跡することで、各ピラーごとのパフォーマンスを把握。多くのインタラクションが生まれるテーマを特定でき、今後の制作にも自信が持てます。
投稿単位のインプレッション(Socialinsiderで追跡) – 個々の投稿がユーザーのフィードで表示された回数。投稿別のアナリティクスでインプレッションを比較すれば、リーチを生む要因(メッセージ、投稿タイプ、広告等)が見えてきます。
投稿単位のいいね(Socialinsiderで追跡) – 個別投稿のいいね数。どのコンテンツがオーディエンスに好評か明確に分析できます。
投稿単位のリプライ(Socialinsiderで追跡) – 個別投稿のリプライやコメント数。対話を生むコンテンツ特性が分かります。より深いエンゲージメント取得のヒントになります。
投稿単位のリポスト(Socialinsiderで追跡) – 投稿がリポストまたはリツイートされた回数。シェアされやすいコンテンツ特性や要素を時間をかけて見極められます。
投稿単位のエンゲージメント率(Socialinsiderで追跡) – 個別投稿を見たユーザー(インプレッションまたはフォロワー)のうち何%がエンゲージメントしたか。最も高パフォーマンスな投稿を特定するのに役立ちます。たとえば同じエンゲージメント数でも、インプレッションの多い方がエンゲージメント率が低ければ、一方がより優秀と判断可能です。
投稿タイプ別エンゲージメント(Socialinsiderで追跡) – リンク、テキスト投稿、写真、GIFアニメ、動画などコンテンツタイプごとのエンゲージメントを可視化。どのフォーマットがより効果的かをすぐ把握でき、今後のコンテンツ施策に反映できます。
エンゲージメント上位投稿(Socialinsiderで追跡) – エンゲージメントが最も高い投稿のランキング。トップ投稿を分析・再現することで、さらなるエンゲージメント向上が目指せます。
エンゲージメント下位投稿(Socialinsiderで追跡) – エンゲージメントが最も低い投稿。トップと同様に下位も追跡することで、効果の薄いコンテンツや施策をやめて、リソースや予算の無駄を避けることができます。
X(Twitter)アナリティクスレポートの作成方法
Creating detailed X (Twitter) analytics reports is helpful for you, the rest of your team, and company stakeholders. They’ll help you:
- Track performance to make sure your posts and activity are hitting KPIs
- Identify patterns and trends to refine your content creation efforts
- Gather helpful intel on your audience and competitors
- Communicate how your Twitter marketing is supporting wider business objectives
You can create Twitter reports in various formats by following the steps below.
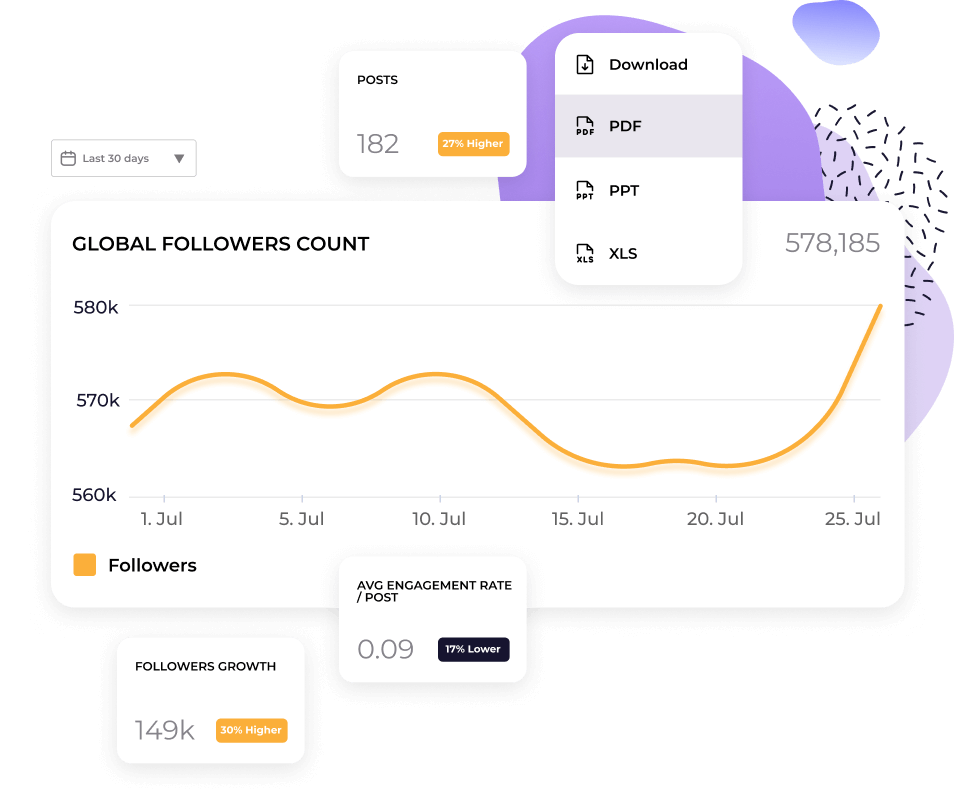
a) CSV reports - create with SocialinsiderWith Socialinsider, you can export any data you see in your dashboard. Whether it’s a profile overview or top-performing posts, just look out for the “Download” button in the top-right corner.
When you click this, you’ll see a dropdown menu with different formats. Select CSV to export your data, which you can then import into Microsoft Excel or Google Sheets (note that only certain reports can be exported as CSVs).
b) PPT, PDF or Excel reports - create with SocialinsiderTo export your Socialinsider data into PPT, PDF or Excel reports, simply follow the same steps as above, but select a different format from the dropdown menu.
You can also automate reporting to get your favorite reports sent straight to your inbox. Just head to the “Autoreports” section in the left hand sidebar and start scheduling.
c) Looker studio - create with GoogleIf you’re working with a lot of data (for example, across multiple profiles, channels or brands), you might wish to use Google’s Looker studio (formerly Google Data Studio). Looker is a data visualization platform that can help you present and analyze your Twitter data in a bigger, more sophisticated marketing dashboard.
To pull in your Socialinsider data, log into Google Looker, go to “Data sources” and connect Socialinsider.
X(Twitter)アナリティクス競合レポートの作成方法
あなたのTwitterアカウントは多くのデータを提供しますが、自分のメトリクスだけに注目してもソーシャルメディアで成功することはできません。本当にTwitterマーケティング戦略を強化するには、競合分析とベンチマークを定期的に実施し、競合や業界リーダーがどのような施策を行っているか(または見落としているか)を把握する必要があります。これにより、以下が可能になります。
- 競合と比較して自社がどのようにパフォーマンスしているか把握できます
- 現実的なKPIや目標を設定できます
- 自分の業界・分野での会話やトレンドを把握し続けられます
- 成功した戦略を再現したり、まだ誰も気付いていないチャンスに素早く対応できます
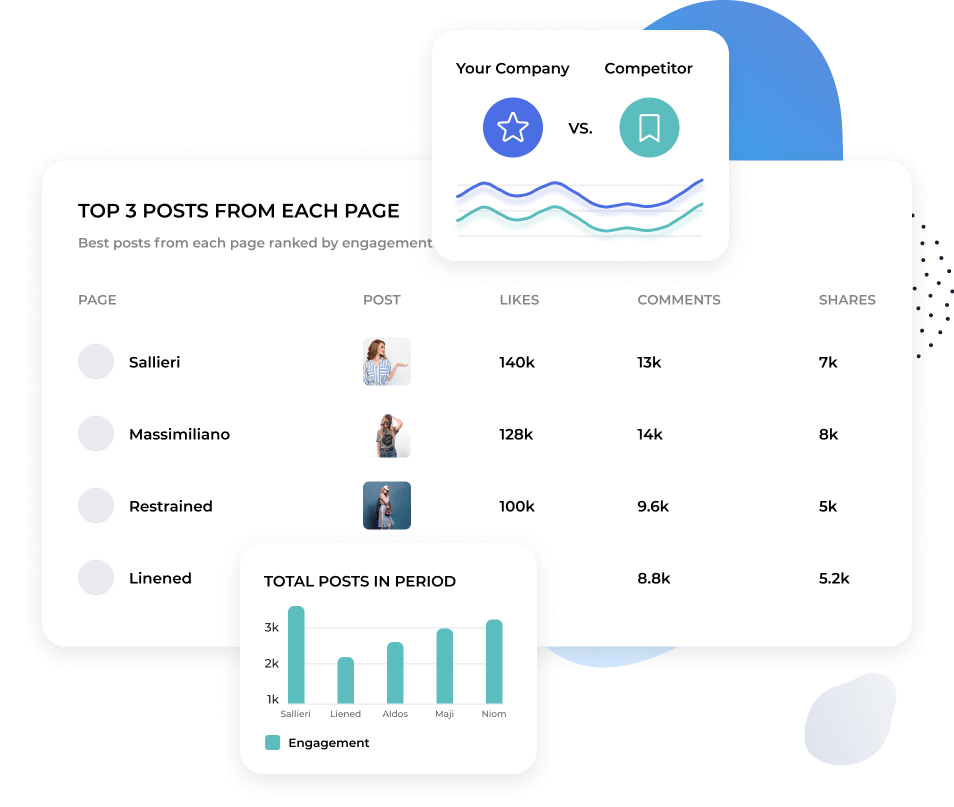
幸いにも、Socialinsiderの競合分析ツールを使えば、他社アカウントのTwitterアナリティクスも簡単に確認できます。それぞれのTwitterプロフィールで以下をトラッキングできます。
- どのトピックがオーディエンスに一番響いているか? ー 競合のエンゲージメントを生む主要なテーマや話題を特定し、自社投稿のインスピレーションにしましょう。
- 投稿は時間とともにどうパフォーマンスしているか? ー 自社と競合のアカウント両方で投稿パフォーマンスをトラッキング・比較できます。アルゴリズム変更で全体のインプレッションが変動している場合など、パターンを素早く発見し、更に深く理解できます。
- フォロワーの成長 ー 競合のフォロワー数や成長率を監視し、自社との拡大スピードを比較できます。成長のきっかけとなる要素を見つけ、どのようにフォロワーを獲得・失っているのか把握し、自社戦略の最適化に役立てましょう。
- AIコンテンツピラー ー SocialinsiderのAI解析により、競合の投稿を教育系・エンタメニュースなど特定ピラーごとにグループ化できます。競合(あるいは憧れのブランド)のエンゲージメント要因を知ることで、彼らの戦略を分析し、自社のコンテンツミックスも改善できます。
これらの競争力あるメトリクス全体を分析することで、自分の分野で何が有効か・そうでないかを正確に評価し、データドリブンな意思決定で競合を上回るパフォーマンスが実現できます。
X(Twitter)のアナリティクスはどうなりましたか?
X(旧Twitter)のアナリティクスは、かつて全ユーザーに無料で提供されていました。最近の変更により、TwitterのネイティブアナリティクスページはPremiumサブスクリプションのユーザーのみ利用可能です。現在Twitterアナリティクスを見る方法が気になる方は、次の2つの選択肢があります。
a)Xの有料プラン(PremiumまたはPremium+)にアップグレードする
b)Socialinsiderなどのサードパーティ製アナリティクスツールに登録する
現在、Xアナリティクスはどこにありますか?
Xアナリティクスは現在ペイウォールの内側に移動しました。そのため、パフォーマンスデータにアクセスするにはPremiumサブスクリプションが必要です。代わりに、有料Xプランにアップグレードせず、Socialinsiderのようなサードパーティーツールを使うことで、高度なレポートやインサイトを取得できます。
なぜ自分のツイートのアナリティクスが表示されないのですか?
ツイートのアナリティクスが表示されない場合は、ご利用中のXプランをご確認ください。無料またはBasicプランでは、Xアナリティクスにアクセスできません。Premiumサブスクリプションにアップグレードするか、Socialinsiderのようなサードパーティーツールをご利用ください。
現在、Twitter投稿のアナリティクスはどこにありますか
投稿のアナリティクスは引き続きご利用いただけますが、プレミアムユーザー限定です。表示されなくなった場合は、有料プラン以外でアナリティクスへのアクセスがXにより制限されたためです。アップグレードせずに、Socialinsiderなどのサードパーティ製アナリティクスプラットフォームで高機能なTwitterアナリティクスもご利用いただけます。
Twitterアナリティクスデータを全体像で把握できます
自社のTwitterパフォーマンスを競合と比較できます。そのデータを活用して戦略的な意思決定を行ってください。