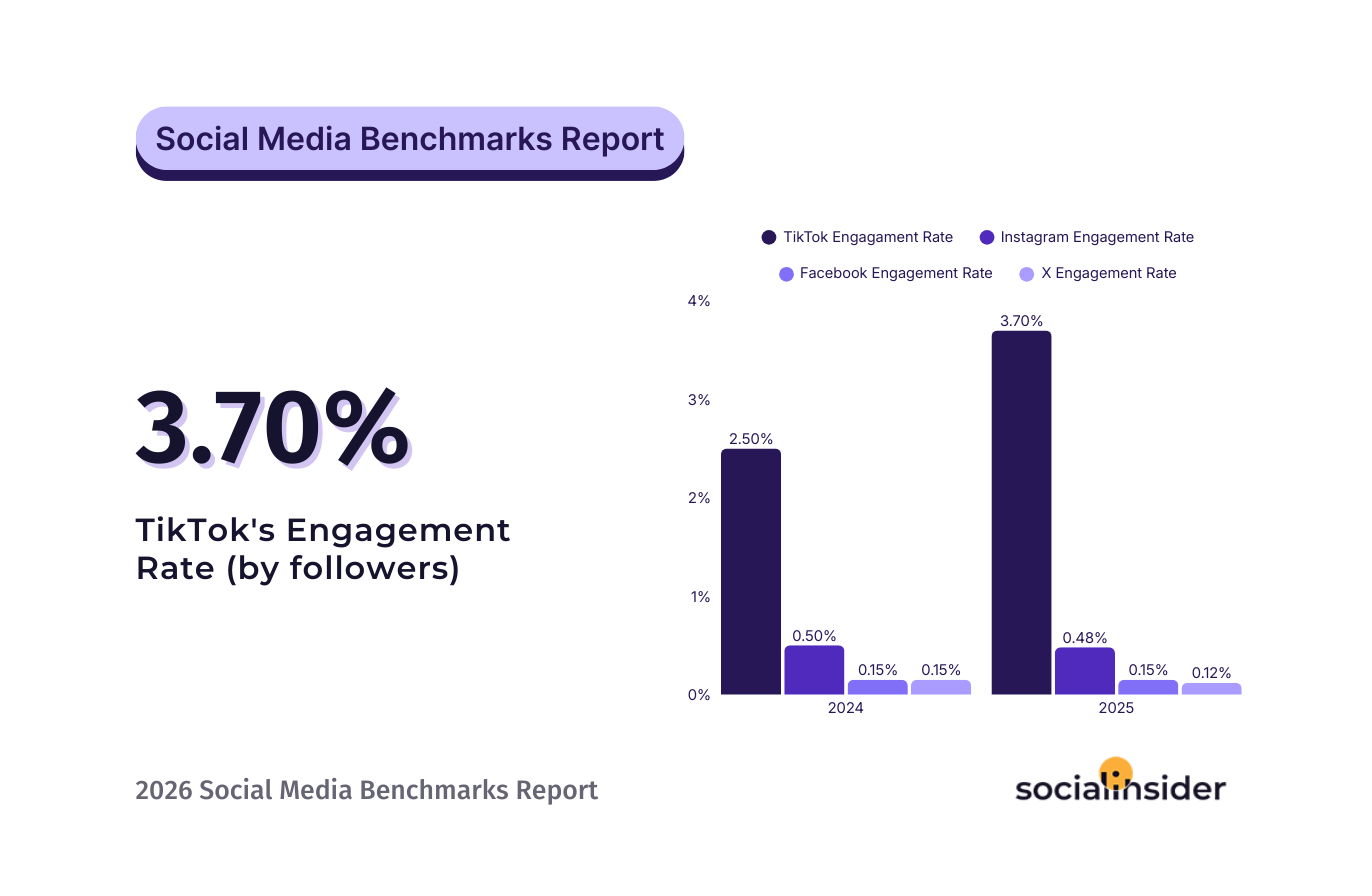
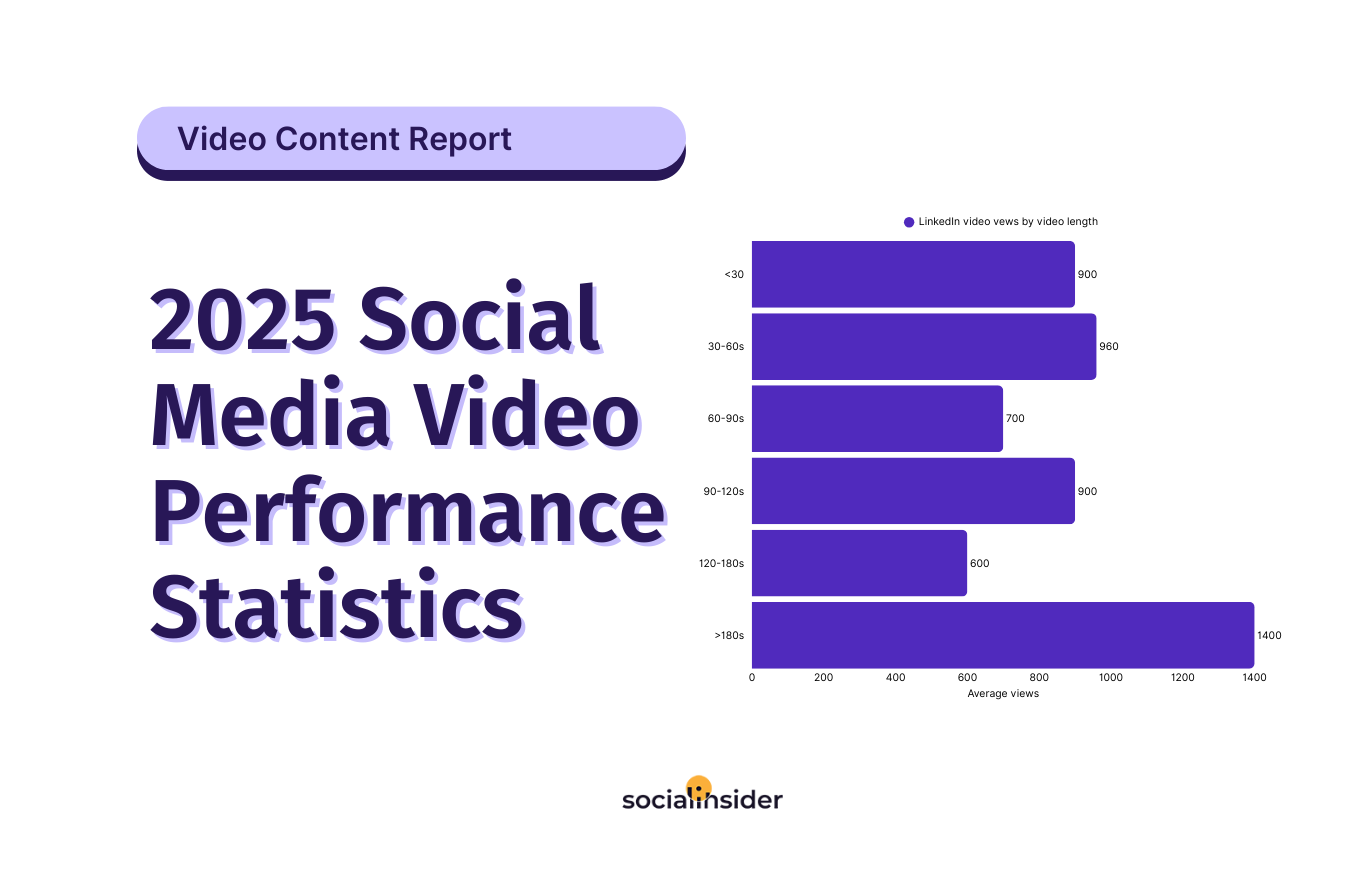
アナリティクスとベンチマーク
重要なメトリクスを測定し、自社のパフォーマンスを競合他社と比較できます。
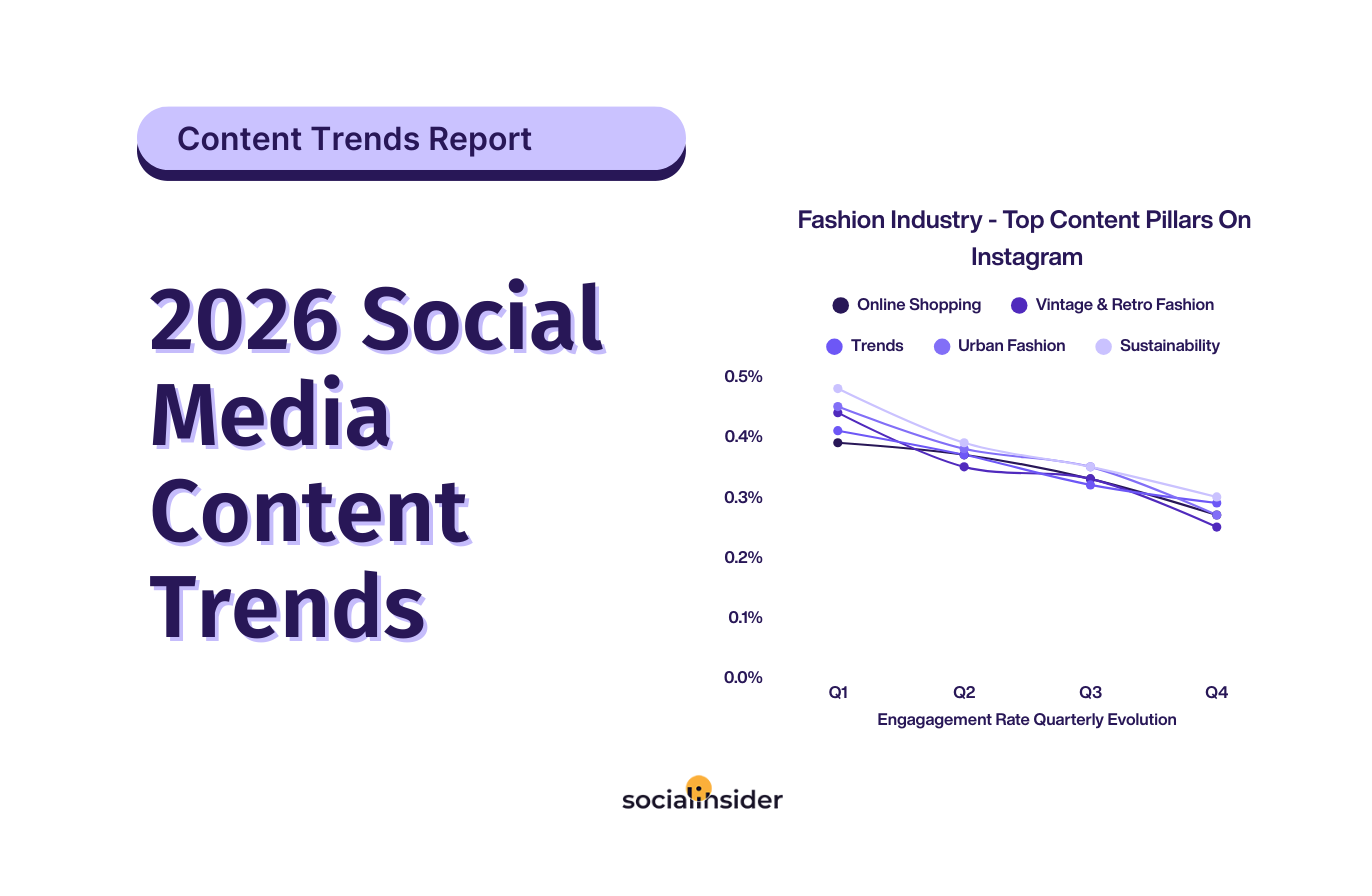
ソーシャルメディアコンテンツ分析
最も成果の高いコンテンツの柱を特定し、再現してください。
ソーシャルメディアデータ統合
ソーシャルメディアAPI連携でビジネスラインを拡大しましょう。
ネットワーク
製品デモを見る
Socialinsiderの始め方を学びましょう。
無料ツール
ソーシャルメディアのパフォーマンスを分析し、改善点を見つけましょう。
ヘルプセンター
スムーズかつ効率的なオンボーディングのための、Socialinsiderを使いこなすガイドです。
新機能・お知らせ
最新の製品変更や改善点をすべて確認し、Socialinsiderのツールの使い方を学びます。
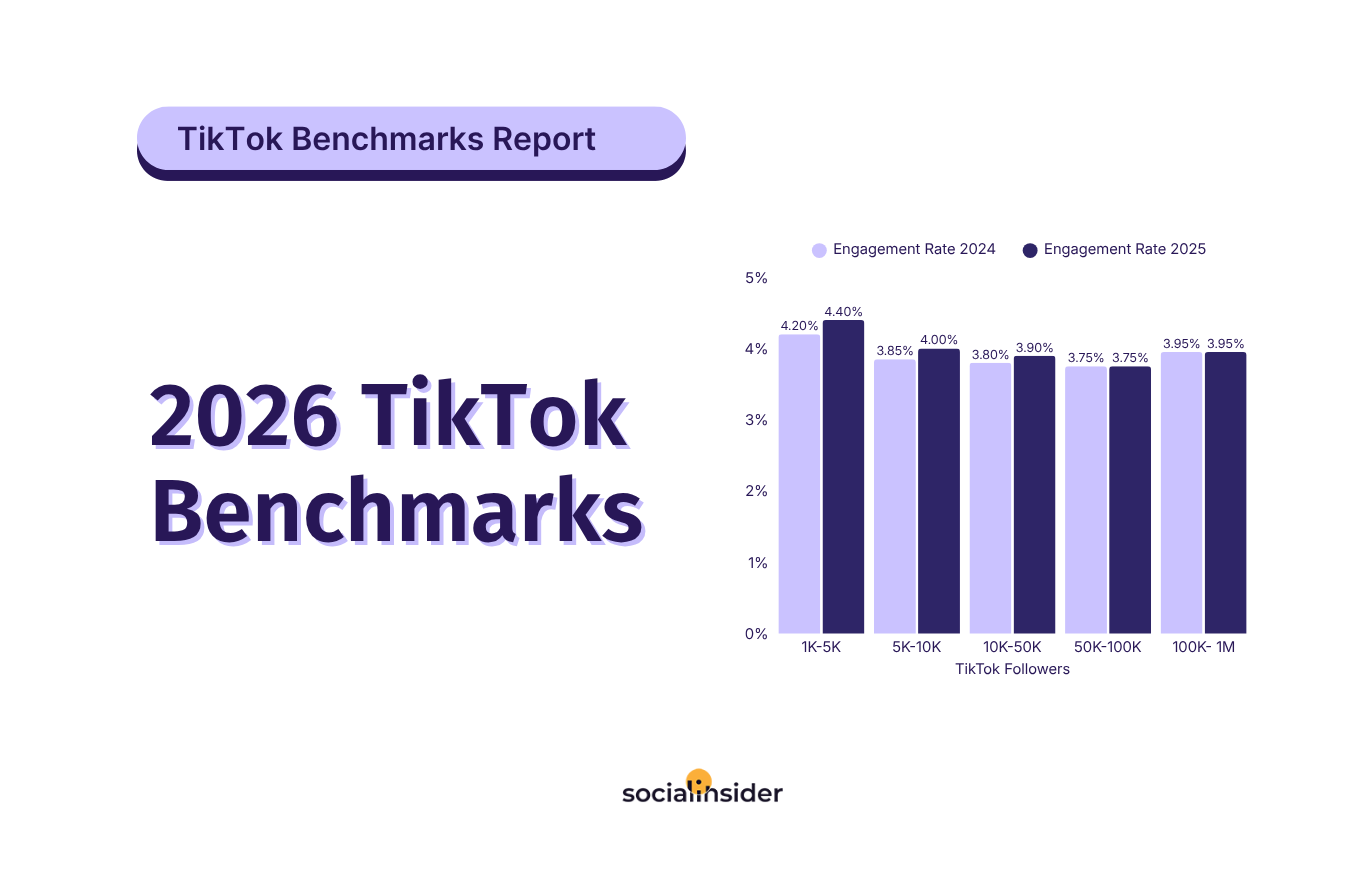
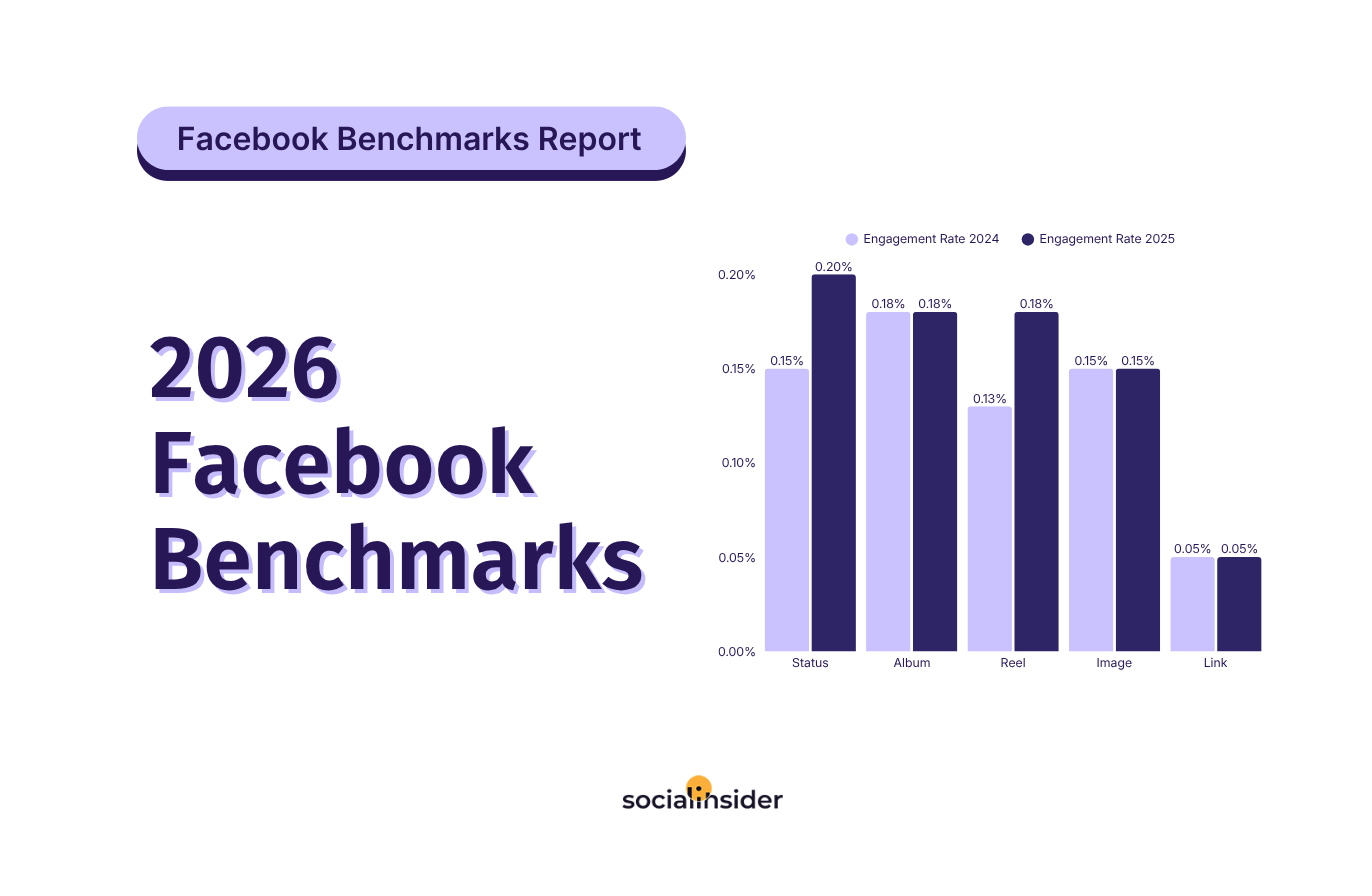
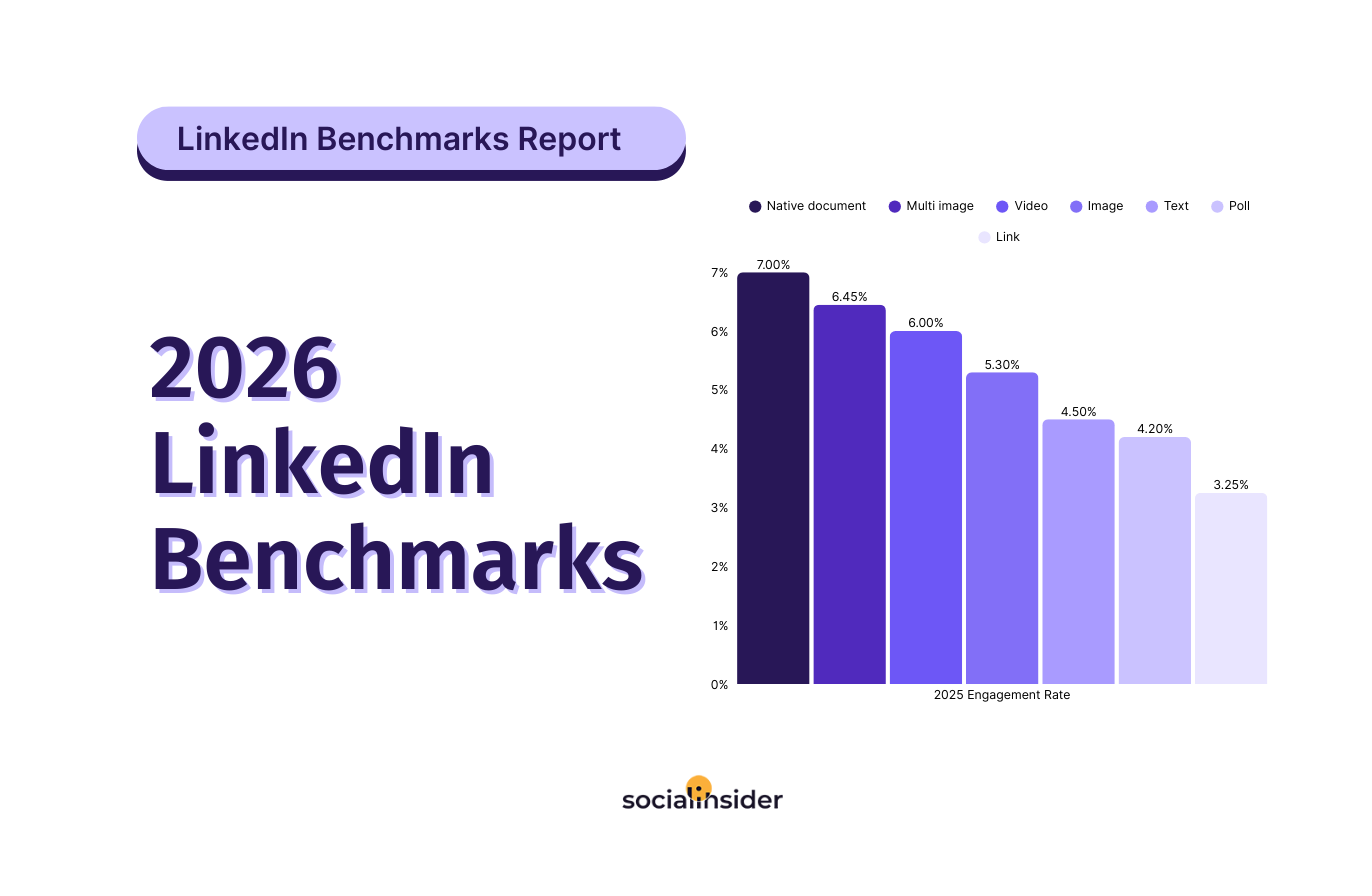
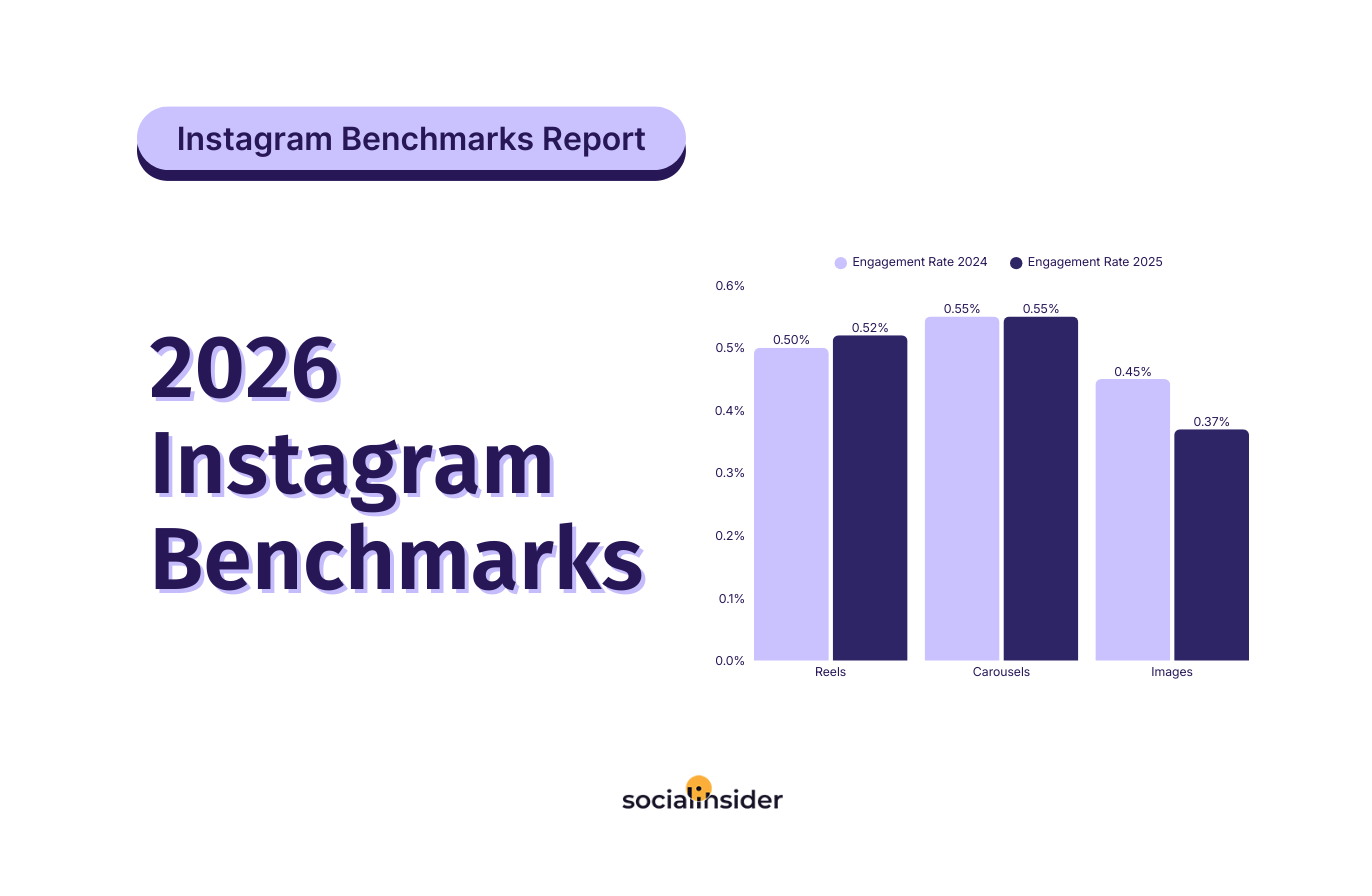
ソーシャルメディアベンチマークレポート
特定のソーシャルメディアプラットフォームで自社のパフォーマンスを競合と比較します
ライブセッション
業界の専門家による最新のソーシャルメディア戦略を発見できます
ニュースレター
エンゲージメントやリーチなどのソーシャルメディア最新情報を深掘りする「A Glitch in the Metrics」ニュースレターです。
Instagramのパフォーマンスを比較しましょう!
競合のソーシャルメディア戦略を分析し、優位に立ちましょう。
独自調査や研究でソーシャルメディアのトレンドやインサイトを常に把握できます。最新のデータに基づくリソースをご覧ください。