Twitter analytics beyond what the platform shows you
One dashboard, a full competitive view. Socialinsider pulls engagement, growth, and content data for any public Twitter profile and puts it next to yours.


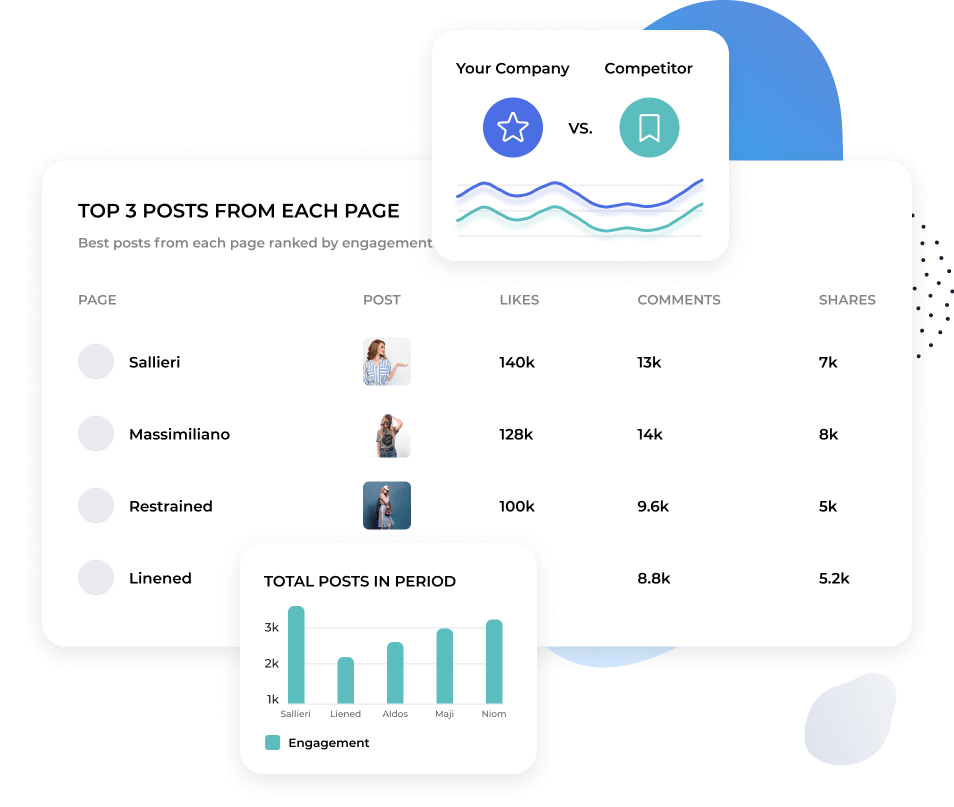
Benchmark your Twitter profile against any competitor
Add any public Twitter profile and see engagement, impressions, replies, retweets, and follower growth side by side with your own.
No need to go back and forth between profiles or take 100 screenshots. It’s all in one view for immediate analysis & insights.
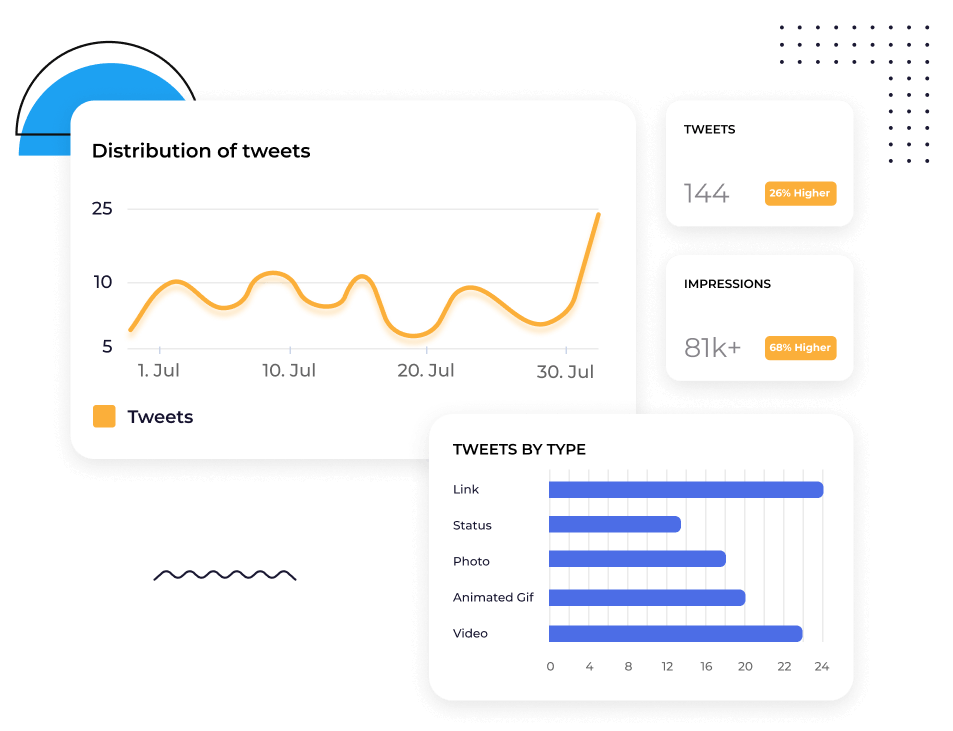
어떤 콘텐츠가 Twitter에 반영되는지 파악합니다
Twitter의 변화는 빠릅니다. 오늘 반응을 얻는 콘텐츠가 내일은 아닐 수 있습니다.
Socialinsider breaks down content performance at the post level and groups it by theme, so you can see which topics and formats consistently earn engagement — not just which individual posts went viral.


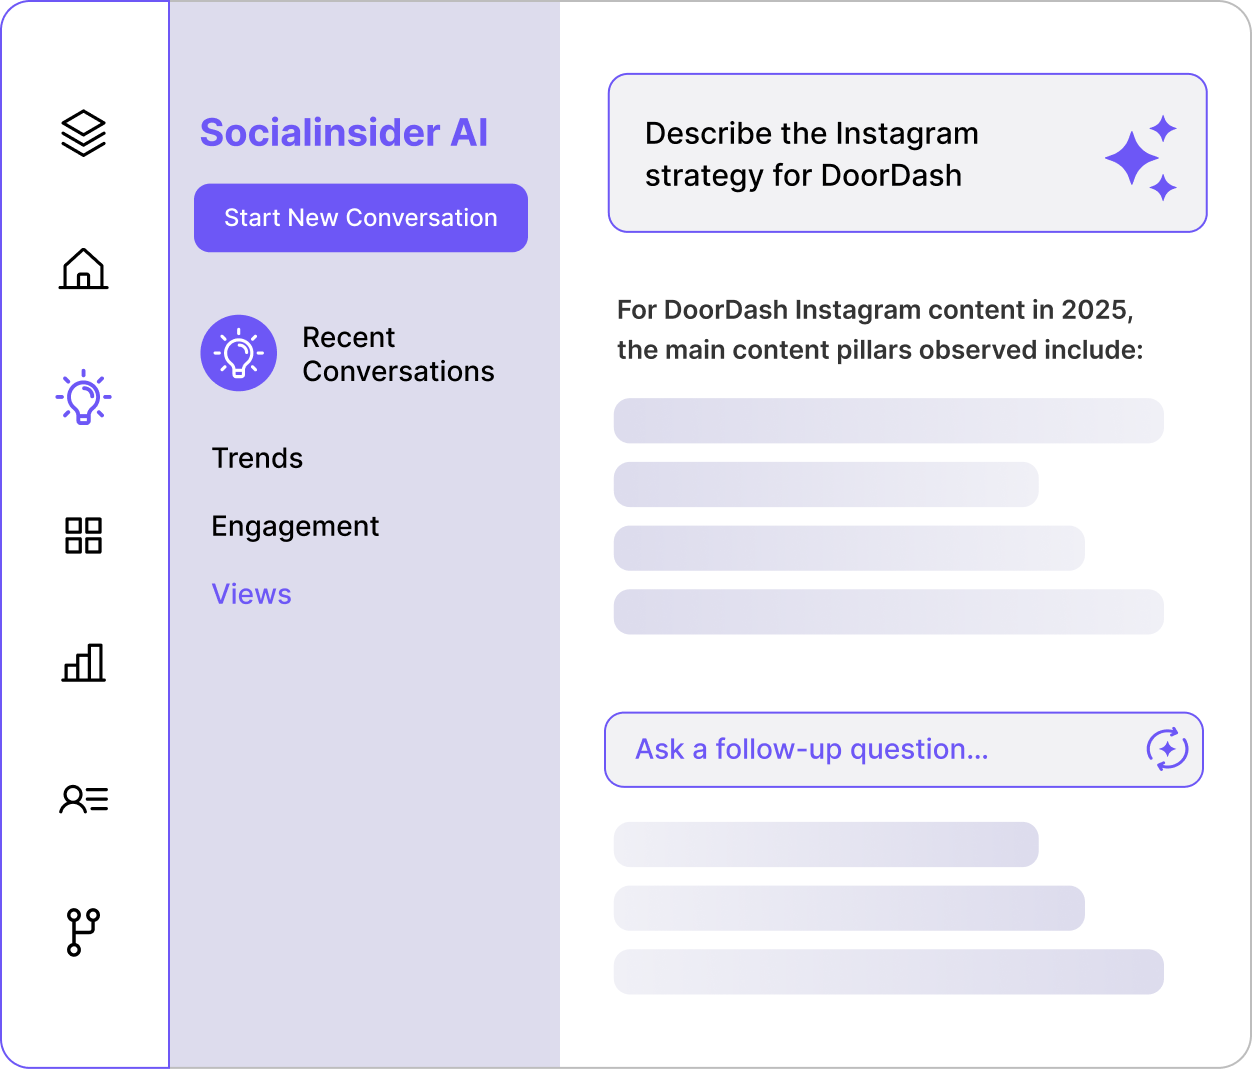
Socialinsider AI에게 Twitter 프로필에서 무슨 일이 일어나는지 문의하세요
Ask a question like: Why did replies spike last week? or How does our posting frequency compare to [competitor]?
Socialinsider AI는 귀하의 트위터 데이터, 경쟁사 데이터, 업계 벤치마크를 기반으로 바로 실행할 수 있는 답변을 제공합니다.
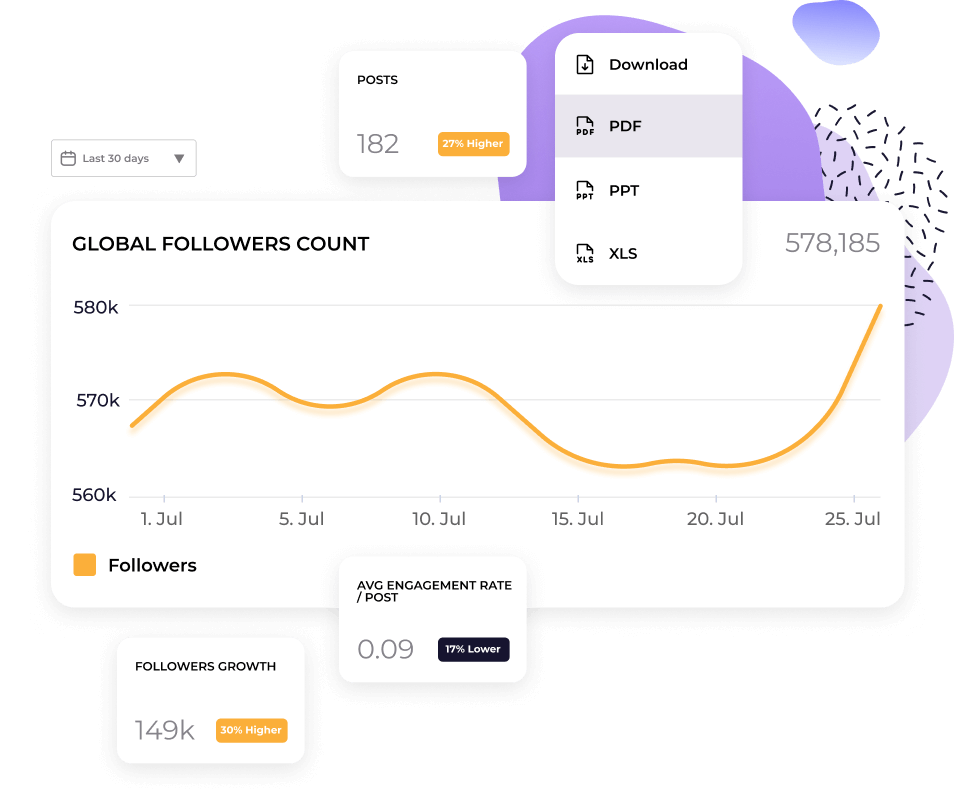
트위터 보고서를 바로 사용할 수 있는 보고서로 자동화합니다
트위터 분석 데이터를 CSV, 엑셀, PDF, PPT로 내보낼 수 있습니다. 대시보드를 Looker Studio에서 운영한다면 연결하세요.
보고서는 포맷과 브랜딩이 이미 적용되어 매달 프레젠테이션을 다시 만들 필요가 없습니다.
고객들이 저희에 대해 말하는 것
"고객 서비스도 제가 가장 좋아하는 기능 중 하나였습니다. 여러분은 정말 탁월합니다. 팀 전체가 매우 신속하게 대응해주고, 친절하며 도움이 됩니다. 이런 경험은 흔하지 않습니다."

"Socialinsider helped us understand whether we're improving or decreasing especially compared to the other accounts that we follow."

"Socialinsider는 경쟁사 분석을 통해 시장 대비 성과 인사이트를 제공합니다."

"감정 분석이 인스타그램 해시태그에 정말 뛰어납니다. 이 새로운 소셜 미디어 리스닝 대시보드는 장기적인 계획에 큰 도움이 되었습니다."

"We are using this social media analytics dashboard for all our 40 social media clients. We can have all the performance data in one single place."

"With Socialinsider, our team became more efficient. We do not need to spend time on social media data gathering. Instead, we can focus on insights and analysis."

"We use Socialinsider for day-to-day social media insights if we need to outline any simple strategic changes or review the performance of certain social posts."

"평균적으로 브랜드의 소셜 미디어 보고서를 Socialinsider에서 작성하면 1~2시간이면 충분합니다. 이전에는 데이터를 수집하는 데 하루가 걸렸습니다."

"Socialinsider 덕분에 연간 1만 6천 달러 이상을 절감했습니다. 월간 보고서와 복잡한 장기 분석에 드는 시간을 절약할 수 있었습니다."

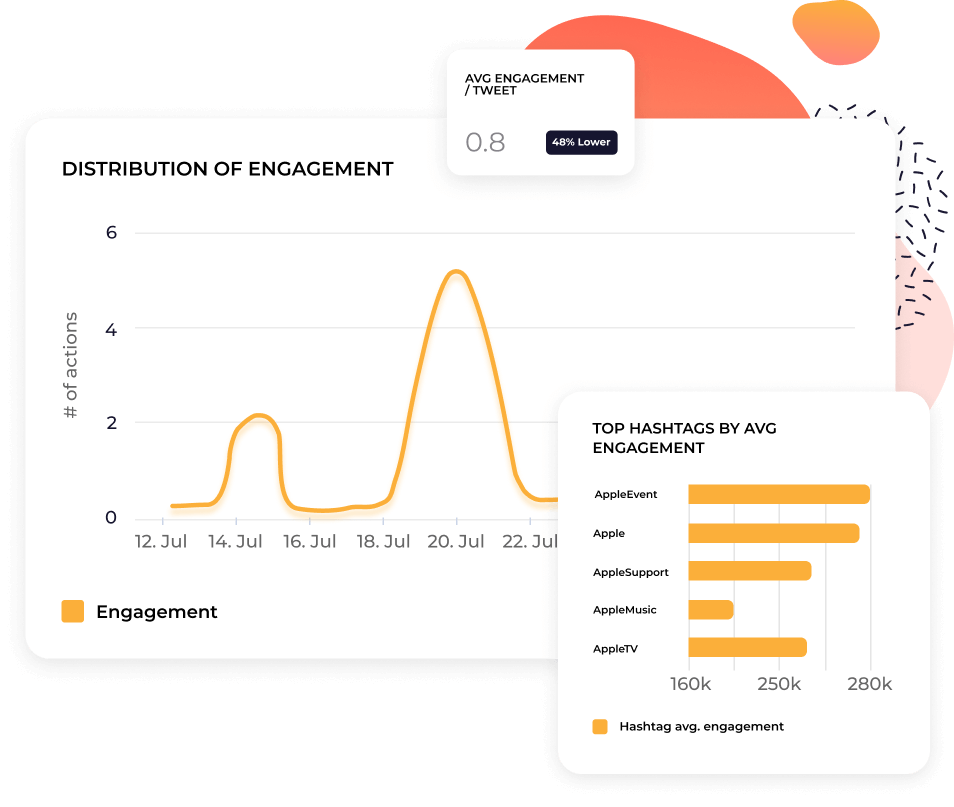
Socialinsider에서 트위터 인게이지먼트 비율을 추적하는 방법
Socialinsider의 소셜 미디어 분석과 경쟁사 분석 도구로 소셜 미디어 성과를 측정하고, 감사하며, 성과를 비교할 수 있습니다.
Socialinsider에서 체험 계정을 만드세요
Add your competitors and connect the profiles you manage
모든 트위터 비즈니스 계정의 인게이지먼트 지표를 확인하세요.
Compare your performance against your top competitors
Perform a cross-channel analysis to evaluate your Twitter performance.

경쟁력 있는 인사이트를 얻고
소셜 미디어 분석 지표를 탐색하세요
자주 묻는 질문
궁금한 점이 있으신가요? 저희가 답변해드립니다.
What is Twitter analytics?
X (Twitter) analytics involves collecting and analyzing data from your X account to assess and optimize your strategy and presence on the platform.
You can pull various metrics from your Twitter data, but they broadly fall into three categories:
- Audience: e.g. follower growth, demographics and active times.
- Content: e.g. Tweet impressions, video views, engagements, engagement rates and link clicks.
- Campaign performance: e.g. cost per engagement, conversion rates, and return on ad spend (ROAS).
You can either monitor your Twitter activity using native Twitter analytics (but be warned: this is only available with a paid X premium plan) or with a third-party tool, like Socialinsider.
Effectively tracking and interpreting your analytics data is crucial to any successful Twitter marketing strategy. Twitter insights will help you:
- Run a Twitter audit: with a comprehensive overview of all your Twitter activity, you can quickly identify what is and isn’t working—without wasting time or budget on tactics that aren’t serving your business objectives.
- Measure content performance: by understanding which content gets the most views, impressions, likes, replies or retweets, you can tailor future posts to boost performance.
- Analyze profile growth: tracking your profile visits and followers will reveal whether your content is driving tangible page growth.
- Identify trends: across your audience, industry and the platform at large—so you can keep up with the fast-paced conversations Twitter is famous for.
- Export data for reporting and measuring ROI: keep a close eye on how spend and resource is translating to ROI. Export data from Twitter analytics to create clear, actionable reports for you and company stakeholders.
X(트위터) 분석을 추적하는 것이 중요한 이유
마케팅 전략에 소셜 미디어를 활용한다면, 소셜 미디어 분석에 익숙해져야 합니다. 특히 트위터에서는 더욱 중요합니다.
우선, 트위터의 본질 자체가 다소 압도적으로 느껴집니다. 3억 명이 넘는 이용자, 방대한 양의 트윗, 그리고 아주 빠르게 전개되는 대화들. 이 속에서 소음을 뚫고 메시지를 전달하는 것이 가능한지 의문이 생길 수 있습니다.
그리고 2022년 일론 머스크가 인수한 후 트위터는 이름을 X로 바꾸는 것뿐만 아니라 엄청난 변화가 있었습니다:
- 기능 및 활용성 - 머스크는 X를 "모든 것을 담은 앱"으로 상상한다고 밝혔습니다. 이로 인해 플랫폼에는 쇼핑, X 프리미엄 계정, 광고 수익 분배 등 다양한 새로운 기능이 계속 추가되고 있습니다.
- 더 다양한 콘텐츠 - 이전에는 140자 이내의 짧은 트윗이 특징이었지만, X에서는 유료 사용자가 더 긴 텍스트와 다양한 멀티미디어 콘텐츠를 올릴 수 있도록 글자 수 제한을 늘렸습니다.
- 오디언스 변화 - X는 인수 이후 약 3,270만 명의 이용자를 잃었지만, 세부적으로 보면 Z세대 이용자 증가가 눈에 띕니다(Z세대의 45%가 X 사용).
브랜드는 트위터 분석을 어떻게 활용할 수 있나요
브랜드는 과거부터 KFC나 Wendy’s 같은 패스트푸드 브랜드처럼 즐겁게 소통하고 실시간으로 오디언스와 교감하기 위해 트위터를 활용해 왔습니다. 하지만 최근 변화로 인해 X에 계속 투자할 가치가 있는지 고민이 생길 수 있습니다.
그래서 트위터 분석이 그 어느 때보다 중요합니다. 이 도구는 그런 의문에 답을 줄 수 있습니다. 다음과 같은 효과를 얻을 수 있습니다:
- 경쟁 정보 수집 - 업계 내 다른 트위터 프로필과 활동을 모니터링해 경쟁 우위를 확보하세요. 경쟁 브랜드는 성공하고 있나요? 핵심 대화 주제는 무엇인가요? 시장이 포화 상태인지, 또는 채울 수 있는 틈새가 있는지 파악할 수 있습니다. 이 모든 것이 X에서 브랜드 존재감을 유지할 가치가 있는지 보여줍니다.
- 더 나은 고객 경험 제공 - 효과적인 마케팅 전략은 오디언스 이해에서 시작합니다. 트위터 팔로워 분석으로 어떤 고객층이 유입되고 있는지 확인해, 이들의 니즈와 선호도를 모든 트윗과 캠페인에 반영할 수 있습니다. 콘텐츠뿐만 아니라, X는 실시간 고객지원 채널로도 중요하다는 점을 잊지 마세요.
- 트렌드와 패턴 파악 - 트위터는 트렌드 중심적이고, 속도도 매우 빠릅니다. 뉴스와 이벤트를 둘러싼 대화가 실시간으로 이뤄지는 만큼, 분석을 활용해 새로운 이슈를 모니터링하고 시즌별 패턴과 오디언스 행태를 파악할 수 있습니다. 브랜드가 시대에 맞게 변화하고, 중요한 순간을 포착할 수 있도록 도와줍니다.
- 최고의 콘텐츠 식별 - 비유료 사용자는 280자, 유료 사용자는 최대 4,000자의 트윗을 올릴 수 있습니다. 하지만 평균 트윗 길이는 240~259자이며, 하루 5~10회 게시가 권장됩니다. 한정된 공간과 높은 빈도 속에서 성공하려면 자원, 날카로운 메시지, 확실한 브랜드 보이스가 필요합니다. 트위터 활동을 추적해 최고의 게시물과 형식(예: 영상 vs. 텍스트)을 찾고, 콘텐츠 제작을 최적화하며, 성과를 높이세요.
- X(트위터) 인플루언서 및 옹호자 확보 - 가시성 확대, 인게이지먼트 증가, 브랜드 신뢰 구축을 위해 X 인플루언서 및 옹호자와의 협업이 게임 체인저가 될 수 있습니다. 트위터 분석으로 활동이 많은 팔로워와 업계의 인기 리더 및 크리에이터를 찾아낼 수 있습니다. 경품 이벤트 운영, AMA 주최, 프로모션 트윗 협업 등 다양한 활동의 성과도 분석으로 측정하세요.
How to check Twitter analytics
Now you understand why it’s so important to have robust Twitter analytics, you might be wondering how to see your Twitter analytics.
First things first, native Twitter analytics are only available with a paid subscription to X Premium. So if you have an unpaid membership or Basic X subscription, you won’t be able to access your in-app analytics dashboard.
The good news is that you can use a third-party tool, like Socialinsider, to conduct advanced analytics without paying for an X subscription.
Here’s a quick guide to how to access Twitter analytics on X mobile and desktop, and via Socialinsider.
How to check X (Twitter) analytics on mobile
- Open the X (Twitter) app and log in to your account.
- Tap your profile picture to navigate to your page.
- Find a specific tweet you wish to analyze.
- Tap the "•••" (More) icon under the tweet, then select "View Tweet Analytics" to see detailed engagement data like impressions, likes, and retweets.
The mobile version of X (Twitter) analytics is pretty useful for checking Tweet performance on-the-fly. However, you’ll need to use the desktop version for full account analytics.
How to check X (Twitter) analytics on desktop
- Go to X.com or twitter.com and log in to your account.
- Click on “More and Creator Studio” in the left-hand menu, where you’ll find your X Analytics dashboard.
- You’ll be able to see an overview of your account performance, including:
- A 28-day summary of impressions, profile visits, mentions and followers
- Highlights like top tweets, top mentions and top followers
- Tweet and video activity: more granular content metrics like impressions, views and engagements
- Conversion tracking for ad campaigns
You can also explore audience demographics (age, location, active times, etc.) and content trends over time.
How to check X (Twitter) analytics with Socialinsider
Beyond the native analytics dashboard, Twitter analytics tools like Socialinsider can give you more powerful insights to really up your game on X.
If you want to understand long-term analytics, track relevant KPIs in an easy-to-read Twitter analytics dashboard, access competitive data and industry benchmarks, and automate your reporting—all without paying for an X subscription—it’s worth looking into.
Here’s how to view Twitter analytics with Socialinsider:
- Create or log in to your Socialinsider account.
- Create a new project or navigate to an existing project. Click “Connect social accounts”.
- Connect to your X (Twitter) account, then select the page(s) you would like to add.
- From your dashboard, you can select the platform and page you wish to analyze.
- Here, you can access a wide range of advanced analytics—from Socialinsider’s Twitter competitor analysis tools, to historical analytics data for your tweets.
All the X (Twitter) metrics you need to know
Not only is X a very unique social media platform, but it’s also been through some pretty big changes. So you can’t simply copy and paste your reporting strategy from Instagram or Tik Tok—you need to have a solid understanding of which Twitter analytics metrics to track.
But before you start tracking, get clear on your goals first. Your KPIs will depend on your business objectives, but X tends to be best for:
- Growing your audience and increasing brand awareness
- Boosting engagement and nurturing a community
- Driving website traffic
- Direct sales
- Thought leadership
- Customer research and social listening
Broadly speaking, the most important metrics to track are overview metrics, audience metrics and content metrics. Let’s break down each area and understand how each metric feeds into the bigger picture.
Overview metrics
X’s fast pace means you do need to track performance in real-time. This is where overview metrics come in, as they allow you to check all your KPIs at-a-glance.
From this high-level summary of your Twitter account analytics, you can determine the overaleffectiveness of your strategy and quickly spot patterns in performance.
Overview metrics include:
Impressions (track with Socialinsider) - the total number of times your tweet has been seen, which includes multiple views from the same user. Tracking impressions helps you gauge your content reach and brand visibility on X.
Engagement (track with Socialinsider) - the total number of interactions on a tweet, including likes, replies, retweets and clicks on links, hashtags or media. This lets you know if your content is resonating with your audience. Also, high engagement drives visibility in the X algorithm.
Engagement rate (track with Socialinsider) - the percentage of users who have interacted with a Tweet, out of the total users who saw it. You can calculate this by adding up the total engagements on a Tweet, dividing this number by either Tweet impressions OR your total followers, then multiplying by 100 to get a percentage. As fluctuations in visibility may be out of your control (for example, if there is an algorithm update), engagement rate is a useful way to measure the quality of engagement, not just the quantity.
Profile visits (track in the native app) - how many times users click through to your profile. Monitoring profile visits is a useful way to measure how your content is driving interest in your brand, and if people are actively searching for your account. Essentially, do people want to learn more about you?
New followers (track with Socialinsider) - how many new followers you’ve gained over a specific time period. This shows you whether your content and campaigns are driving audience growth. If you’re gaining followers, it indicates that people are interested in building an ongoing relationship with your brand—perhaps they liked a Tweet, and now they want to see what you post next.
Replies (track with Socialinsider) - the number of direct responses to your tweet. Replies signal that your content is driving conversation—which is, after all, the real purpose of Twitter. They’re useful for increasing engagement (as the X algorithm will prioritize content with lots of buzz) and nurturing your community (for example, fostering connection or gathering feedback).
Likes (track with Socialinsider) - the number of likes a Tweet gets. Likes are the easiest way for your audience to interact with your content, making them a quick indicator of whether your content is getting the seal of approval.
Reposts (track with Socialinsider) - the number of times your tweet is reposted or “retweeted”. If someone retweets you, it means they identify with your content and think it’s valuable enough to share with their followers. So by designing your content to be shareable, you can amplify it to a broader audience.
Bookmarks (track in the native app) - how many times users have saved your tweets. Again, bookmarks are a really important value-based metric—even if people don’t publicly interact with your content, saves show that they found it interesting and relevant enough to revisit at a later date.
Shares (track with Socialinsider) - the number of times your content has been shared, both on and off X. This includes reposts or retweets, but also external shares outside of X (for example, via WhatsApp or email). This lets you see how far your message is spreading beyond your immediate audience.
Quotes (track with Socialinsider) - the number of times your tweet is reposted with additional commentary. When users quote your tweet, they are engaging more deeply with your content by sharing their own ideas or hot takes. In other words, your content is not only interesting or valuable, but also thought-provoking.
Follower growth (track with Socialinsider) - the rate at which your total followers are increasing or decreasing over time. It’s essential to analyze your Twitter followers to understand the overall health of your X presence and track the long-term impact of your content.
Audience metrics
Ultimately, your X strategy—from the type of content you create, to the KPIs you track—is going to depend on your unique audience. Do they prefer videos or article links? Are they entertained or baffled by memes? When are they most likely to see your content? Tracking audience metrics can help you answer all of this and more.
Age (track in the native app) - the dominant age brackets of your followers. If you know the age demographics you’re speaking to, you can make sure this aligns with your business’s target audience, tailor your content to better fit their interests and preferences, and refine your messaging so it lands with the right groups.
Gender (track in the native app) - the gender breakdown of your followers. Again, this helps you assess whether your strategy is on track—whether you’re aiming for balanced representation or targeting a specific gender—and optimize your content and advertising efforts accordingly.
Active times (track in the native app) - peak times of the day or week when your audience is most active on X. Because Tweets are more ephemeral than other types of social media content, you want to post when your followers are online—having this data helps you align your schedule.
Country (track in the native app) - the main geographic locations of your followers. Knowing where your followers are based is essential for ad targeting, but also for being sensitive to cultural preferences, and tailoring content or campaigns for a global vs. local audience.
Content metrics
For some businesses, it’s enough to use X for social listening or customer support. But if you want to build a presence that could genuinely impact your bottom line, you need to invest in content. And if you’re going to invest in content, you’re going to need to understand content metrics.
Here are the metrics you need to track to develop a winning content strategy on X:
AI Content Pillars (track with Socialinsider) - using AI, Socialinsider can identify key themes or categories to build your content around. These are what we call “content pillars”. They help you focus and organize your content creation efforts, so you can invest in posts that resonate most with your audience. In Socialinsider, you can see both the volume of content and the engagement rates in different categories.
Engagement for each content pillar (track with Socialinsider) - this measures how well different content pillars perform by tracking likes, replies, retweets, quotes, shares, clicks, etc. By identifying themes that generate the most interactions, you can feel more confident ideating and creating future content.
Impressions on a post level (track with Socialinsider) - the number of times an individual post has been displayed in users’ feeds. Comparing impressions across analytics for individual tweets will show you what specifically drives reach for your page (messaging, post type, paid promotions, etc.).
Likes on a post level (track with Socialinsider) - the number of likes on an individual post. This gives you a clear indication of which content lands well with your audience.
Replies on a post level (track with Socialinsider) - the number of direct responses or comments on an individual post. This will reveal what kind of content drives deeper engagement by sparking conversations.
Reposts on a post level (track with Socialinsider) - the number of times a post has been reposted or retweeted—in other words, how shareable your content is. By monitoring this over time, you should get an idea of what exactly prompts people to share.
Engagement rate on a post level (track with Socialinsider) - the percentage of people who engaged with an individual post out of the people who saw it (impressions or followers). This is helpful for clarifying your top-performing posts. For instance, if two posts have the same engagement but different impressions, the one with the higher engagement rate stands out.
Post types by engagement (track with Socialinsider) - a breakdown of engagement based on the type of content: links, text posts, photos, animated GIFs or videos. Really handy for easily identifying which formats perform best—so you can create more of what truly engages your audiences.
Top posts by engagement (track with Socialinsider) - a leaderboard of posts with the highest levels of engagement. Ranking post performance will help you replicate and refine successful tactics or content types, so you can keep on hitting new highs of engagement.
Bottom posts by engagement (track with Socialinsider) - the posts with the lowest levels of engagement. This is just as important as tracking top-performers, so you can learn what to stop doing and avoid wasting time, resource or budget on content that doesn’t drive meaningful results.
X(트위터) 분석 보고서 만드는 방법
Creating detailed X (Twitter) analytics reports is helpful for you, the rest of your team, and company stakeholders. They’ll help you:
- Track performance to make sure your posts and activity are hitting KPIs
- Identify patterns and trends to refine your content creation efforts
- Gather helpful intel on your audience and competitors
- Communicate how your Twitter marketing is supporting wider business objectives
You can create Twitter reports in various formats by following the steps below.
a) CSV reports - create with SocialinsiderWith Socialinsider, you can export any data you see in your dashboard. Whether it’s a profile overview or top-performing posts, just look out for the “Download” button in the top-right corner.
When you click this, you’ll see a dropdown menu with different formats. Select CSV to export your data, which you can then import into Microsoft Excel or Google Sheets (note that only certain reports can be exported as CSVs).
b) PPT, PDF or Excel reports - create with SocialinsiderTo export your Socialinsider data into PPT, PDF or Excel reports, simply follow the same steps as above, but select a different format from the dropdown menu.
You can also automate reporting to get your favorite reports sent straight to your inbox. Just head to the “Autoreports” section in the left hand sidebar and start scheduling.
c) Looker studio - create with GoogleIf you’re working with a lot of data (for example, across multiple profiles, channels or brands), you might wish to use Google’s Looker studio (formerly Google Data Studio). Looker is a data visualization platform that can help you present and analyze your Twitter data in a bigger, more sophisticated marketing dashboard.
To pull in your Socialinsider data, log into Google Looker, go to “Data sources” and connect Socialinsider.
X(트위터) 분석 경쟁사 보고서 만드는 방법
트위터 계정에서 다양한 데이터를 확인할 수 있지만, 본인 지표에만 집중해서는 소셜 미디어 성공을 이끌기 어렵습니다. 트위터 마케팅 전략을 한 단계 끌어올리려면, 경쟁사 분석과 벤치마킹을 정기적으로 진행해 업계 리더와 경쟁사들이 무엇을 하고 있는지(또는 놓치고 있는지) 살펴야 합니다. 이렇게 하면 다음과 같은 이점이 있습니다.
- 경쟁사와 비교해 나의 성과를 파악합니다.
- 현실적인 KPI 및 목표를 설정합니다.
- 업계 내 대화와 트렌드 흐름을 따라갑니다.
- 성공한 전략을 복제하거나 누구도 발견하지 못한 기회를 선점할 수 있습니다.
다행히 Socialinsider의 경쟁사 분석 도구를 활용하면, 다른 계정의 트위터 분석도 간편하게 확인할 수 있습니다. 각 트위터 프로필에 대해 다음 항목을 추적할 수 있습니다.
- 청중에게 가장 반응 좋은 주제는 무엇인가요? - 경쟁사에서 인게이지먼트를 높이는 핵심 테마와 주제를 찾으면, 내 게시물에 참고할 인사이트를 얻을 수 있습니다.
- 게시물이 시간에 따라 어떻게 성과를 내는가? - 내 계정과 경쟁사 계정의 게시물 성과를 비교·추적하면, 패턴을 식별하고 임프레션 변화(예: 알고리즘 업데이트로 모두가 경험하는 변화 등) 원인까지 파악할 수 있습니다.
- 팔로워 성장 - 경쟁사 팔로워 수와 성장률을 모니터링하여, 상대적으로 오디언스가 얼마나 빠르게 확장되는지 파악하세요. 성장 패턴의 요인을 분석해, 경쟁사가 어떻게(혹은 왜) 팔로워를 늘리거나 잃는지 인사이트를 얻고 내 전략을 최적화할 수 있습니다.
- AI 콘텐츠 필러 - Socialinsider의 AI 분석을 활용하면 경쟁사 게시물을 교육, 엔터테인먼트 등 주요 카테고리로 묶어 확인할 수 있습니다. 경쟁사가 인게이지먼트를 높이는 요소를 분석해, 그들의 전략을 역설계하고 나만의 콘텐츠 믹스를 다듬으세요.
이런 경쟁 지표를 종합적으로 분석하면, 업계 내에서 효과적인 전략과 그렇지 않은 전략을 명확하게 평가해, 데이터 기반 의사결정을 내리고 경쟁을 앞설 수 있습니다.
What happened to X (Twitter) analytics?
X (formerly Twitter) analytics used to be free to all users on the platform. As of recent changes, the native Twitter analytics page is now only available to users with a Premium subscription. If you’re wondering how to see Twitter analytics now, you have two choices:
a) Upgrade to a paid plan on X (Premium or Premium+)
b) Sign up for a third-party analytics tool, like Socialinsider
Where is X analytics now?
X Analytics has now moved behind the paywall, meaning users need a Premium subscription to access performance data. Alternatively, you can get advanced reporting and insights using a third-party tool like Socialinsider, without needing to upgrade to a paid X plan.
Why can’t I see analytics for my Tweet?
If you can’t see analytics for your tweets, check which type of X plan you are on. If it’s free or Basic, you can no longer access X analytics—you’ll need to either upgrade to a Premium subscription, or use a third-party tool like Socialinsider.
Where are the analytics for posts on Twitter now?
Post analytics are still available, but only for Premium users. If you're no longer seeing them, it’s because X has restricted access to analytics without a paid plan. Alternatively, you can use third-party analytics platforms like Socialinsider for robust Twitter analytics, without needing to upgrade.
트위터 분석 데이터의 전체 모습을 파악하세요
경쟁사와 비교해 Twitter 성과를 확인하세요. 데이터를 기반으로 전략적인 결정을 내리십시오.