Tyson Foods ブランド概要
ソーシャルメディアのパフォーマンスデータを表示 Tyson Foods
Tyson Foods
0.06%
ブランド平均エンゲージメント率Photo
Top Content (By Eng. Rate)1218
Avg. Brand Video ViewsBrand Posts Across Channels
投稿のクロスチャネル分析
Brand Posts Across Channels
| チャンネル | 投稿 | 平均投稿数/日 |
|---|---|---|
 Twitter Twitter | 0 | 0 |
 Facebook Facebook | 65 | 0.36 |
 Instagram Instagram | 61 | 0.34 |
| Total | 126 | 0.7 |
トップ投稿
Tyson Foods Instagram
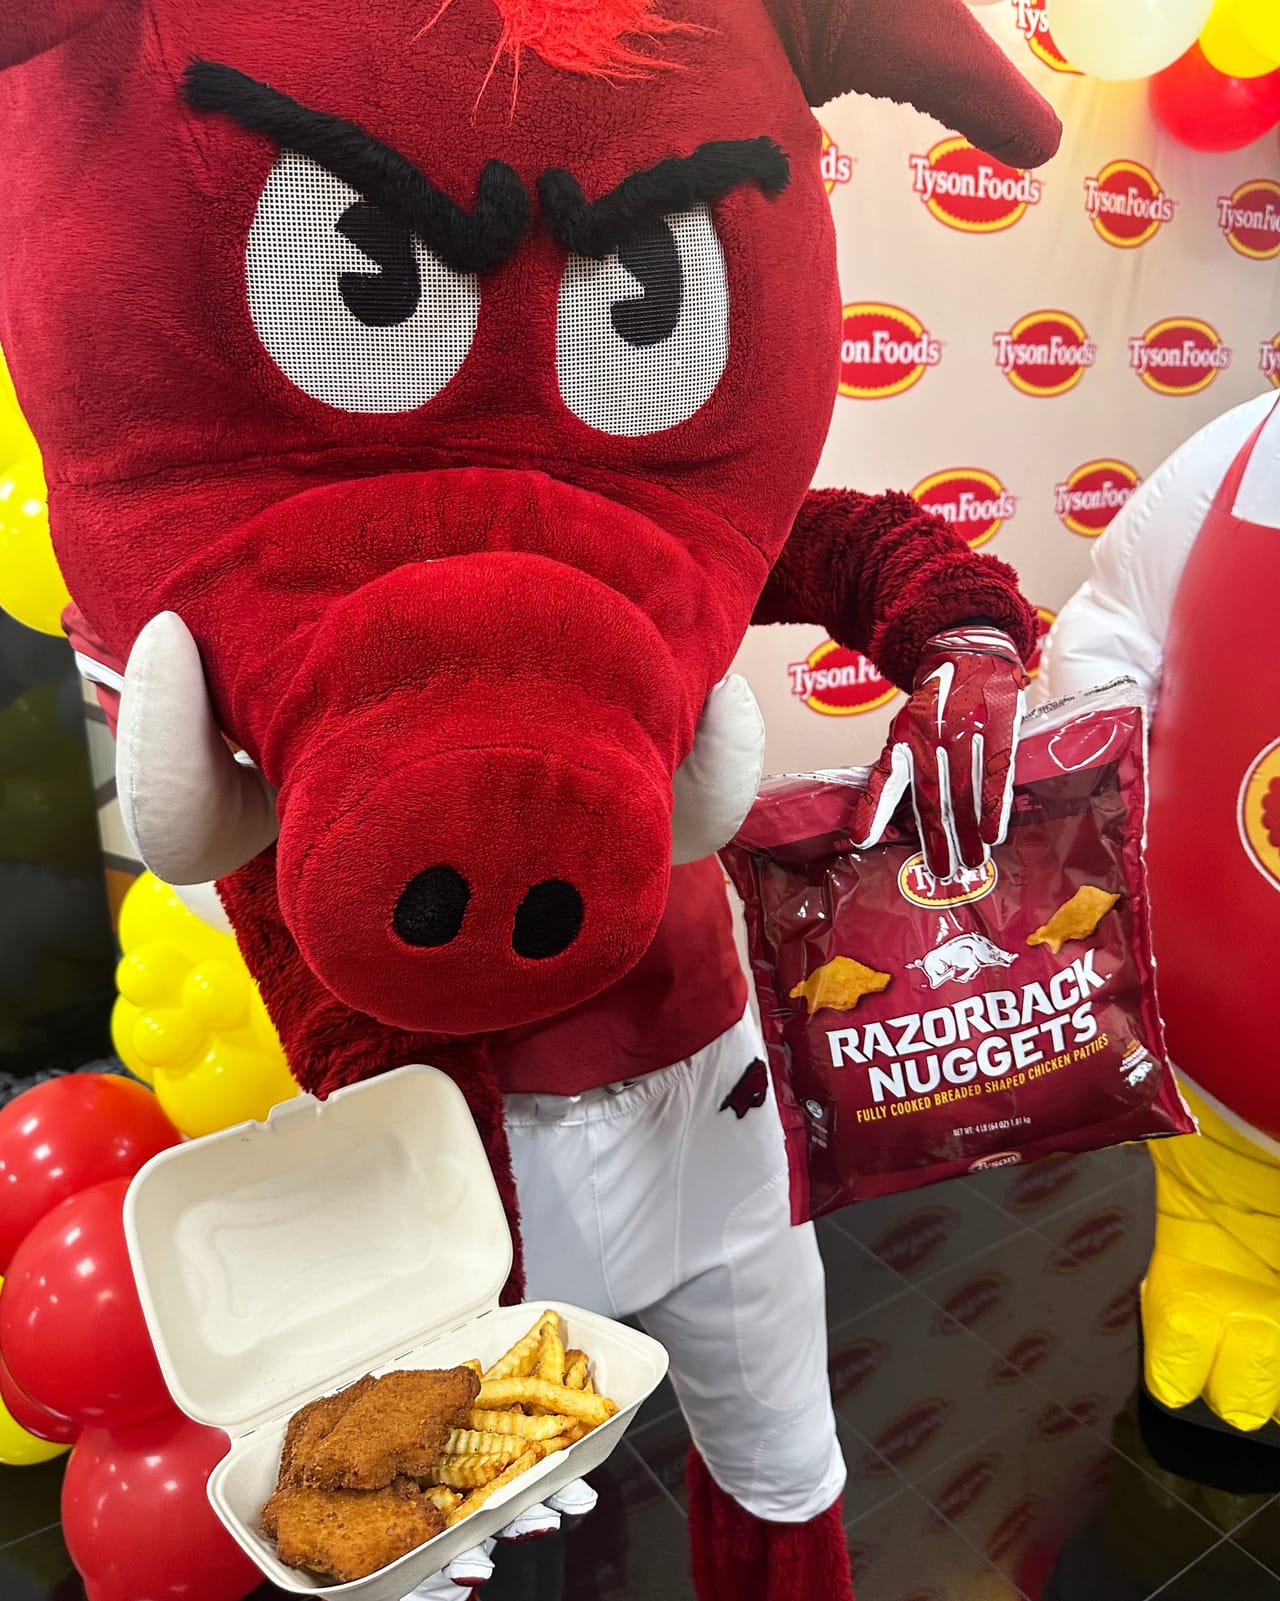
Mar 27, 2025
22K followers
Engagement Rate
1.461%
Tyson Foods Instagram

Jun 26, 2025
22K followers
Engagement Rate
1.434%
Tyson Foods Instagram

Apr 22, 2025
22K followers
Engagement Rate
0.642%
チャネル横断のブランドエンゲージメント
エンゲージメントのチャネル横断分析
チャネル横断のブランドエンゲージメント
| チャンネル | エンゲージメント | 平均エンゲージメント |
|---|---|---|
| Twitter | 0 | 0 |
| Facebook | 3913 | 60.2 |
| Instagram | 2809 | 46.05 |
| Average | 2241 | 35.42 |
チャネル別ブランド動画視聴回数
エンゲージメントのチャネル横断分析
チャネル別ブランド動画視聴回数
| チャンネル | ビデオ視聴回数 | 平均視聴回数 |
|---|---|---|
| Twitter | 0 | 0 |
| Facebook | 133K | 4439 |
| Instagram | 9083 | 432.52 |
| Average | 47K | 1624 |


リアルタイムのインサイトでソーシャルメディア戦略を改善しませんか
戦略的なインサイトを獲得し、全チャネルのソーシャルパフォーマンスを分析します。異なる期間のメトリクスを比較し、レポートを数秒でダウンロードできます。