Columbia University ブランド概要
ソーシャルメディアのパフォーマンスデータを表示 Columbia University

Columbia University
0.21%
ブランド平均エンゲージメント率Carousel Album
Top Content (By Eng. Rate)71K
Avg. Brand Video ViewsBrand Posts Across Channels
投稿のクロスチャネル分析
Brand Posts Across Channels
| チャンネル | 投稿 | 平均投稿数/日 |
|---|---|---|
 YouTube YouTube | 31 | 0.17 |
 Twitter Twitter | 39 | 0.22 |
 Facebook Facebook | 98 | 0.54 |
 Instagram Instagram | 134 | 0.74 |
| Total | 302 | 1.68 |
トップ投稿
Columbia Univers... Instagram
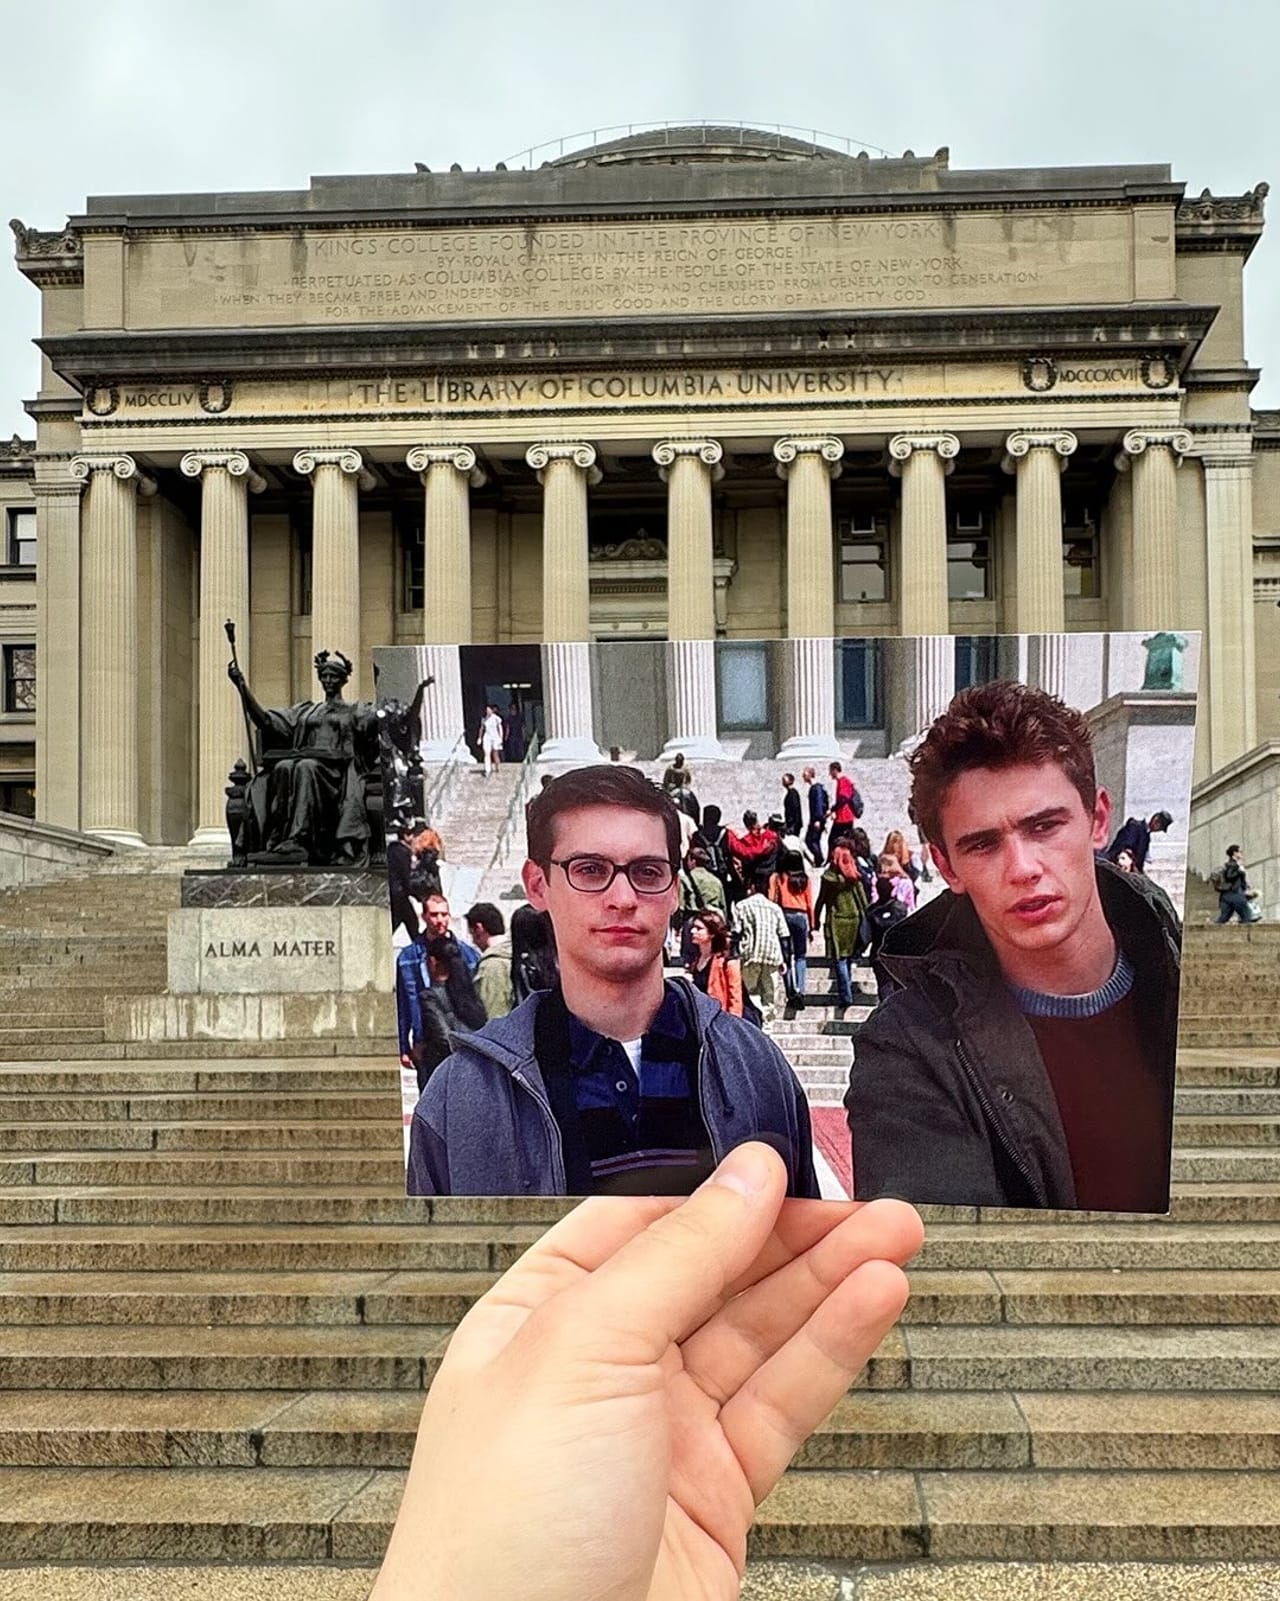
Feb 28, 2025
472K followers
Engagement Rate
5.587%
Columbia Univers... Instagram
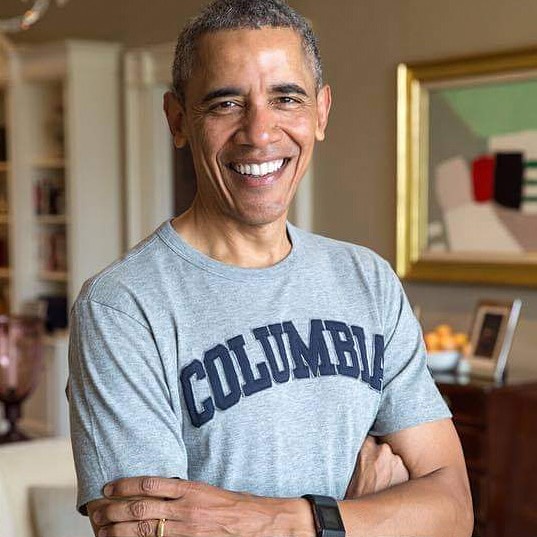
Feb 17, 2025
472K followers
Engagement Rate
5.54%
Columbia Univers... Instagram
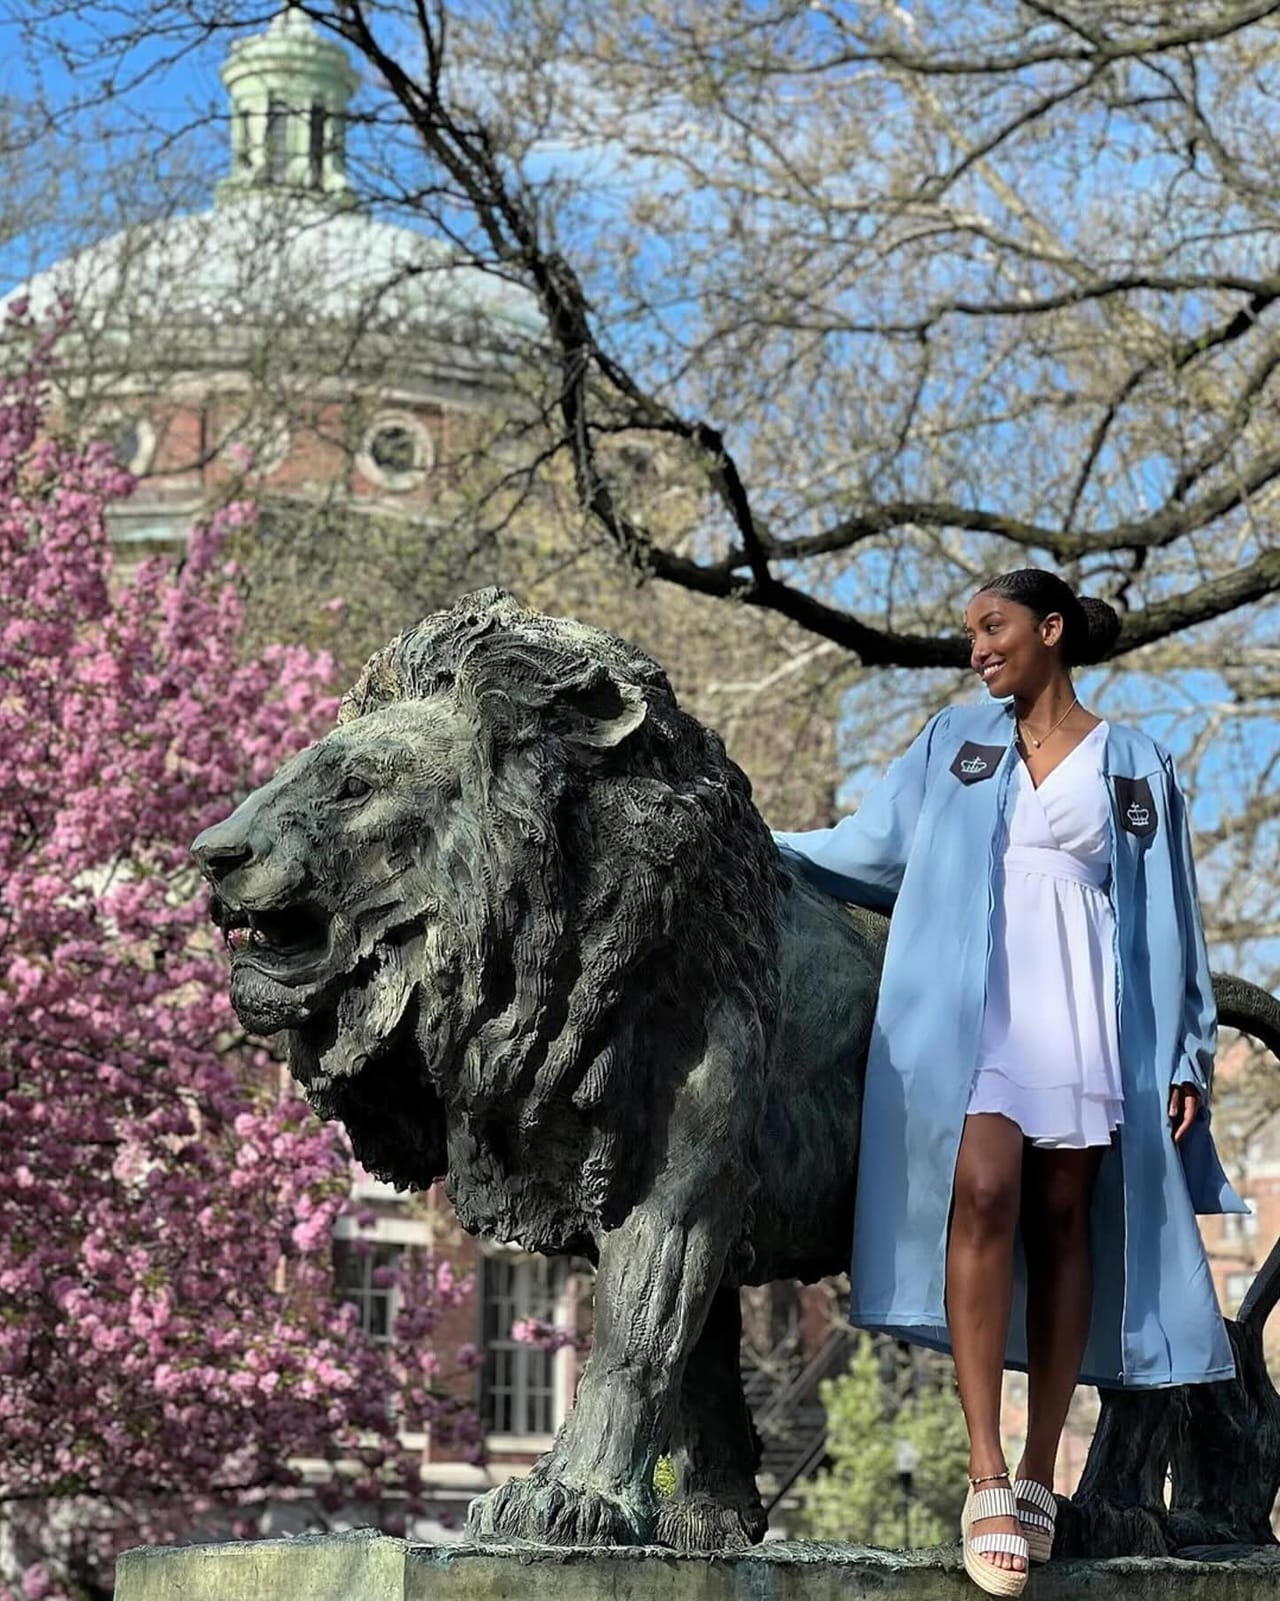
Apr 11, 2025
472K followers
Engagement Rate
2.316%
チャネル横断のブランドエンゲージメント
エンゲージメントのチャネル横断分析
チャネル横断のブランドエンゲージメント
| チャンネル | エンゲージメント | 平均エンゲージメント |
|---|---|---|
| YouTube | 525 | 16.94 |
| Twitter | 6484 | 166.26 |
| Facebook | 31K | 314.57 |
| Instagram | 466K | 3479 |
| Average | 126K | 994.17 |
チャネル別ブランド動画視聴回数
エンゲージメントのチャネル横断分析
チャネル別ブランド動画視聴回数
| チャンネル | ビデオ視聴回数 | 平均視聴回数 |
|---|---|---|
| YouTube | 36K | 1171 |
| Twitter | 678K | 226K |
| Facebook | 484K | 19K |
| Instagram | 1.4M | 37K |
| Average | 660K | 71K |


リアルタイムのインサイトでソーシャルメディア戦略を改善しませんか
戦略的なインサイトを獲得し、全チャネルのソーシャルパフォーマンスを分析します。異なる期間のメトリクスを比較し、レポートを数秒でダウンロードできます。