Highland Spring ブランド概要
ソーシャルメディアのパフォーマンスデータを表示 Highland Spring
Highland Spring
0.46%
ブランド平均エンゲージメント率Photo
トップコンテンツ(エンゲージメント率順)12K
ブランド動画の平均視聴回数ブランド投稿(全チャネル)
投稿のクロスチャネル分析
ブランド投稿(全チャネル)
| チャンネル | 投稿 | 平均投稿数/日 |
|---|---|---|
 Twitter Twitter | 6 | 0.03 |
 Facebook Facebook | 36 | 0.2 |
 Instagram Instagram | 38 | 0.21 |
| Total | 80 | 0.44 |
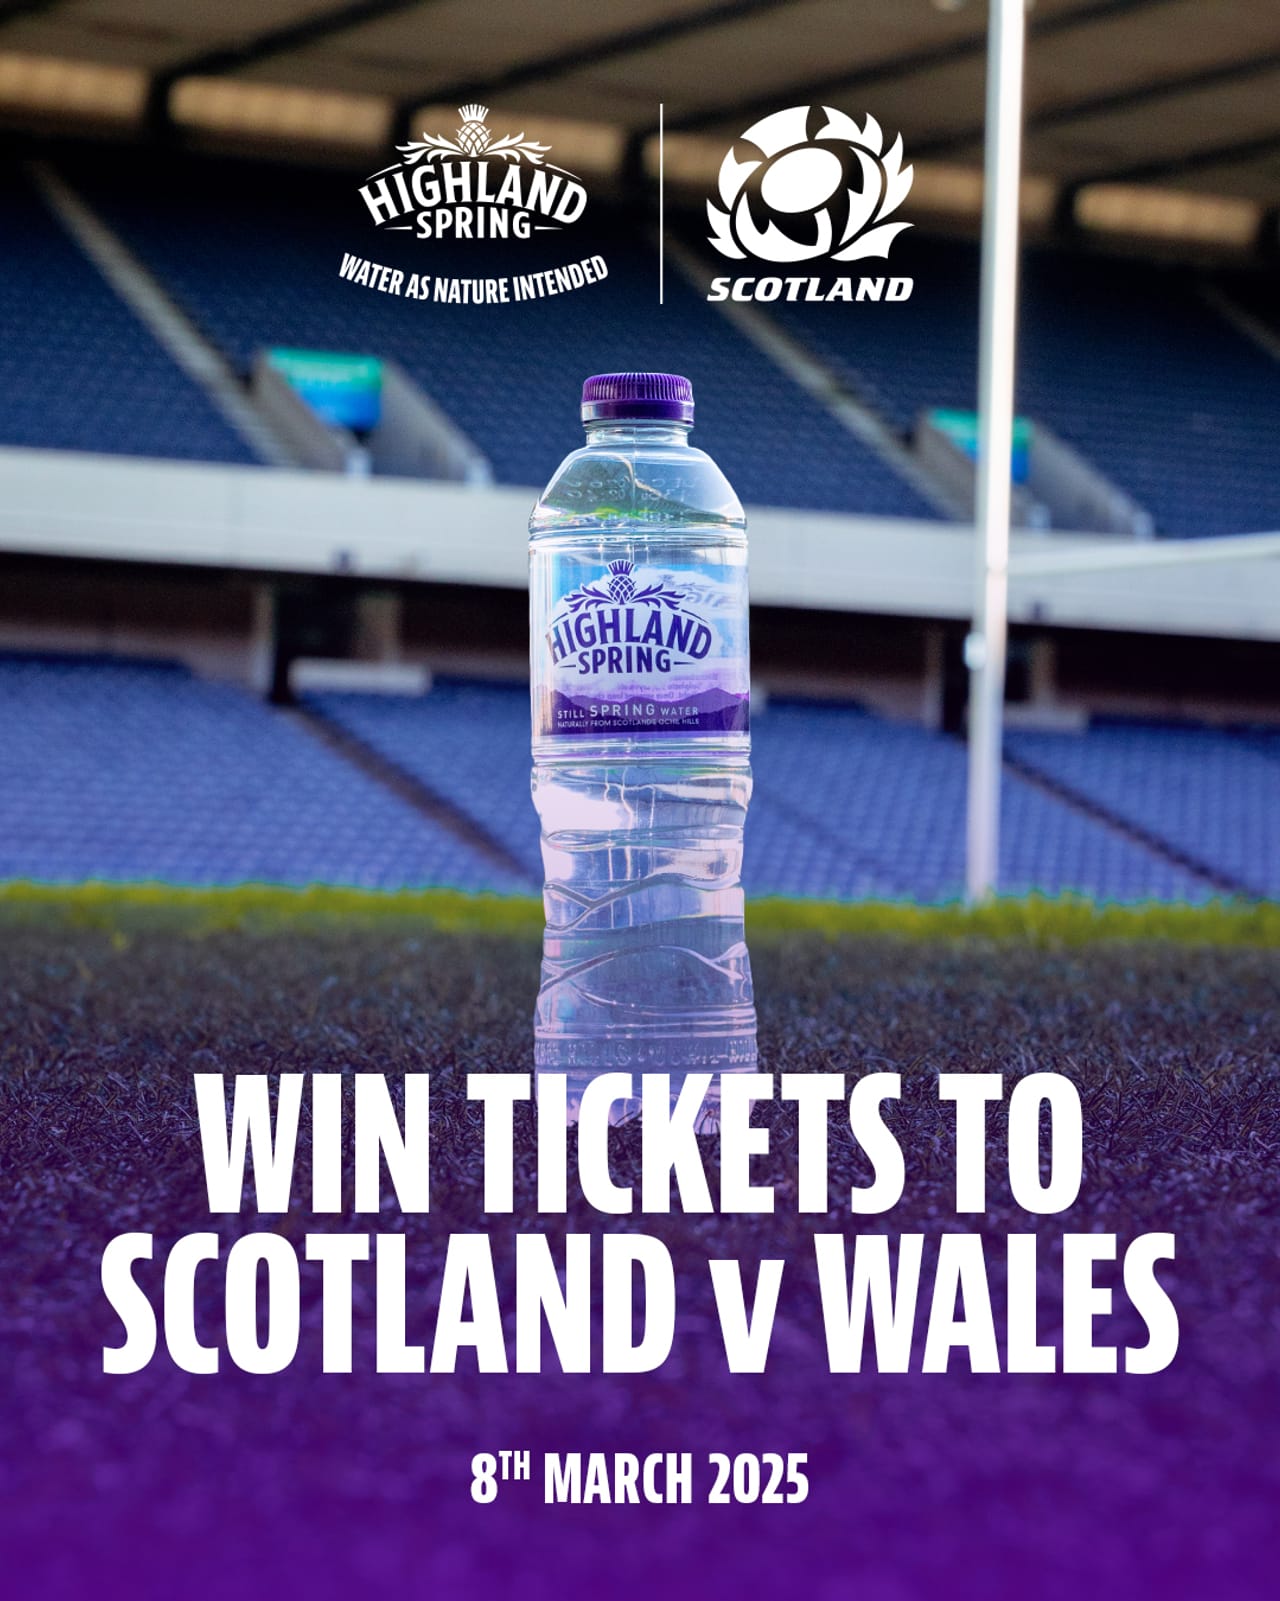
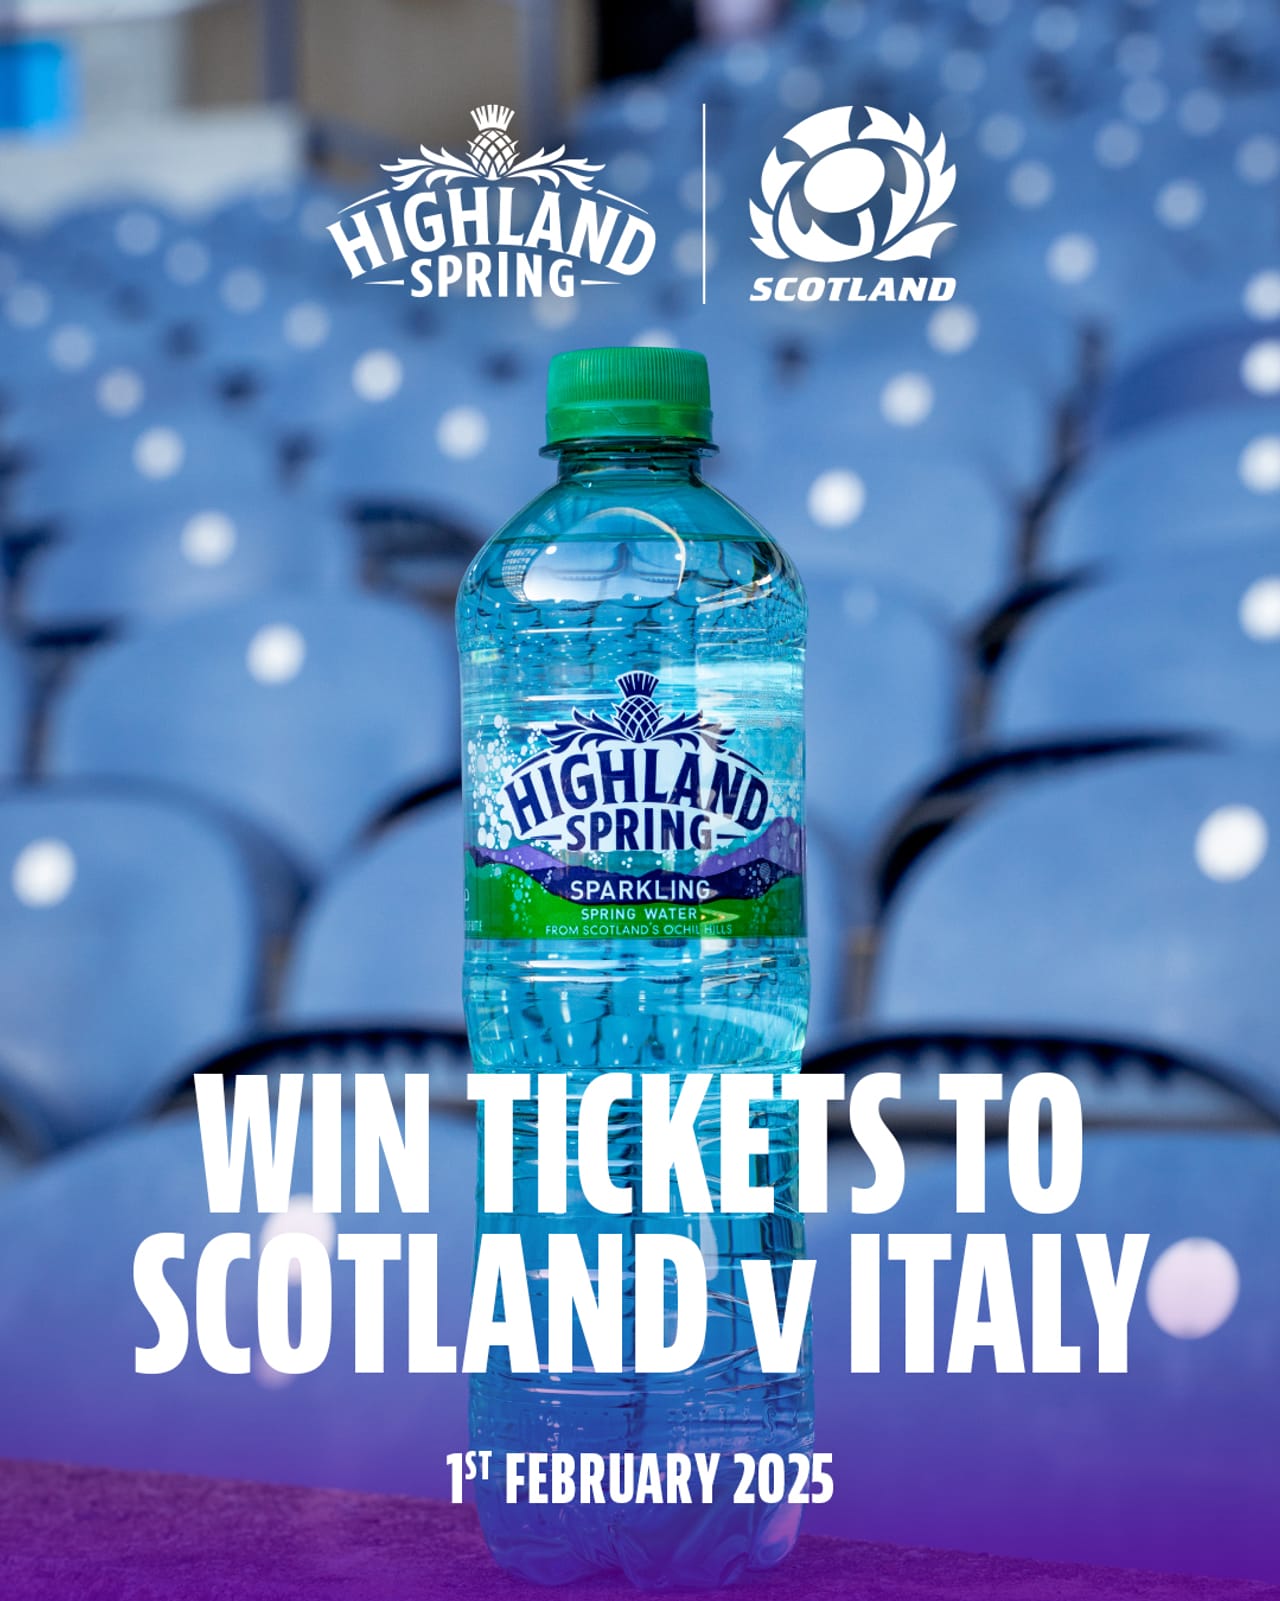
トップ投稿
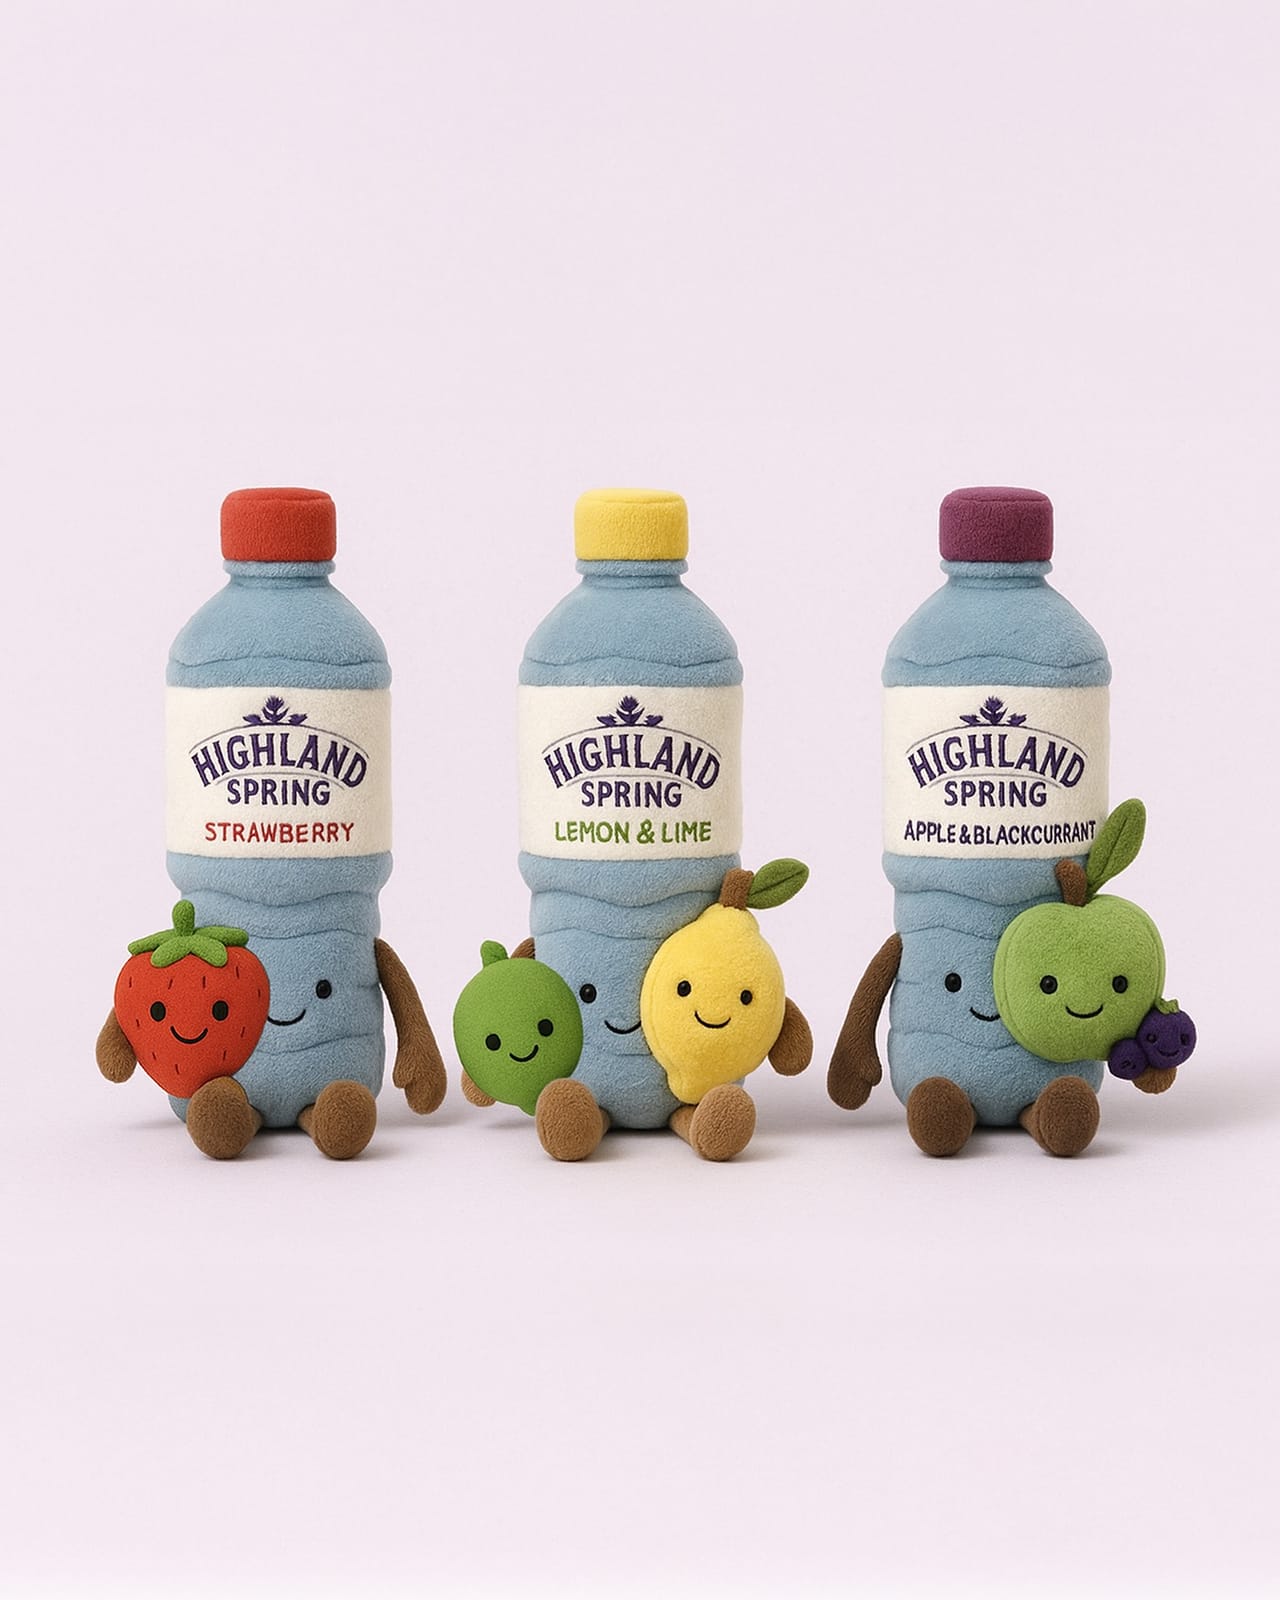
 Highland Spring
 Instagram
Feb 24, 2025
7534 followers
Engagement Rate
3.637%
Highland Spring Instagram
Jan 28, 2025
7534 followers
Engagement Rate
2.986%
Highland Spring Instagram
May 6, 2025
7544 followers
Engagement Rate
2.585%
チャネル横断のブランドエンゲージメント
エンゲージメントのチャネル横断分析
チャネル横断のブランドエンゲージメント
| チャンネル | エンゲージメント | 平均エンゲージメント |
|---|---|---|
| Twitter | 20 | 3.33 |
| Facebook | 10K | 286.25 |
| Instagram | 1871 | 49.24 |
| Average | 4065 | 112.94 |
チャネル別ブランド動画視聴回数
エンゲージメントのチャネル横断分析
チャネル別ブランド動画視聴回数
| チャンネル | ビデオ視聴回数 | 平均視聴回数 |
|---|---|---|
| Twitter | 0 | 0 |
| Facebook | 763K | 35K |
| Instagram | 64K | 2798 |
| Average | 276K | 12K |
類似ブランド
業界トップブランドをチェックしましょう。 FMCG — Beverages 業界


リアルタイムのインサイトでソーシャルメディア戦略を改善しませんか
戦略的なインサイトを獲得し、全チャネルのソーシャルパフォーマンスを分析します。異なる期間のメトリクスを比較し、レポートを数秒でダウンロードできます。