Terres d'Aventure ブランド概要
ソーシャルメディアのパフォーマンスデータを表示 Terres d'Aventure

Terres d'Aventure
0.12
ブランド平均エンゲージメント率Carousel Album
トップコンテンツ(エンゲージメント率順)1146
ブランド平均動画視聴回数ブランド投稿のチャネル別一覧
投稿のチャネル横断アナリシス
ブランド投稿のチャネル別一覧
| チャンネル | 投稿 | 1日あたりの平均投稿数 |
|---|---|---|
 YouTube YouTube | 46 | 0.26 |
 Facebook Facebook | 103 | 0.57 |
 Instagram Instagram | 172 | 0.96 |
| Total | 321 | 1.78 |
トップ投稿
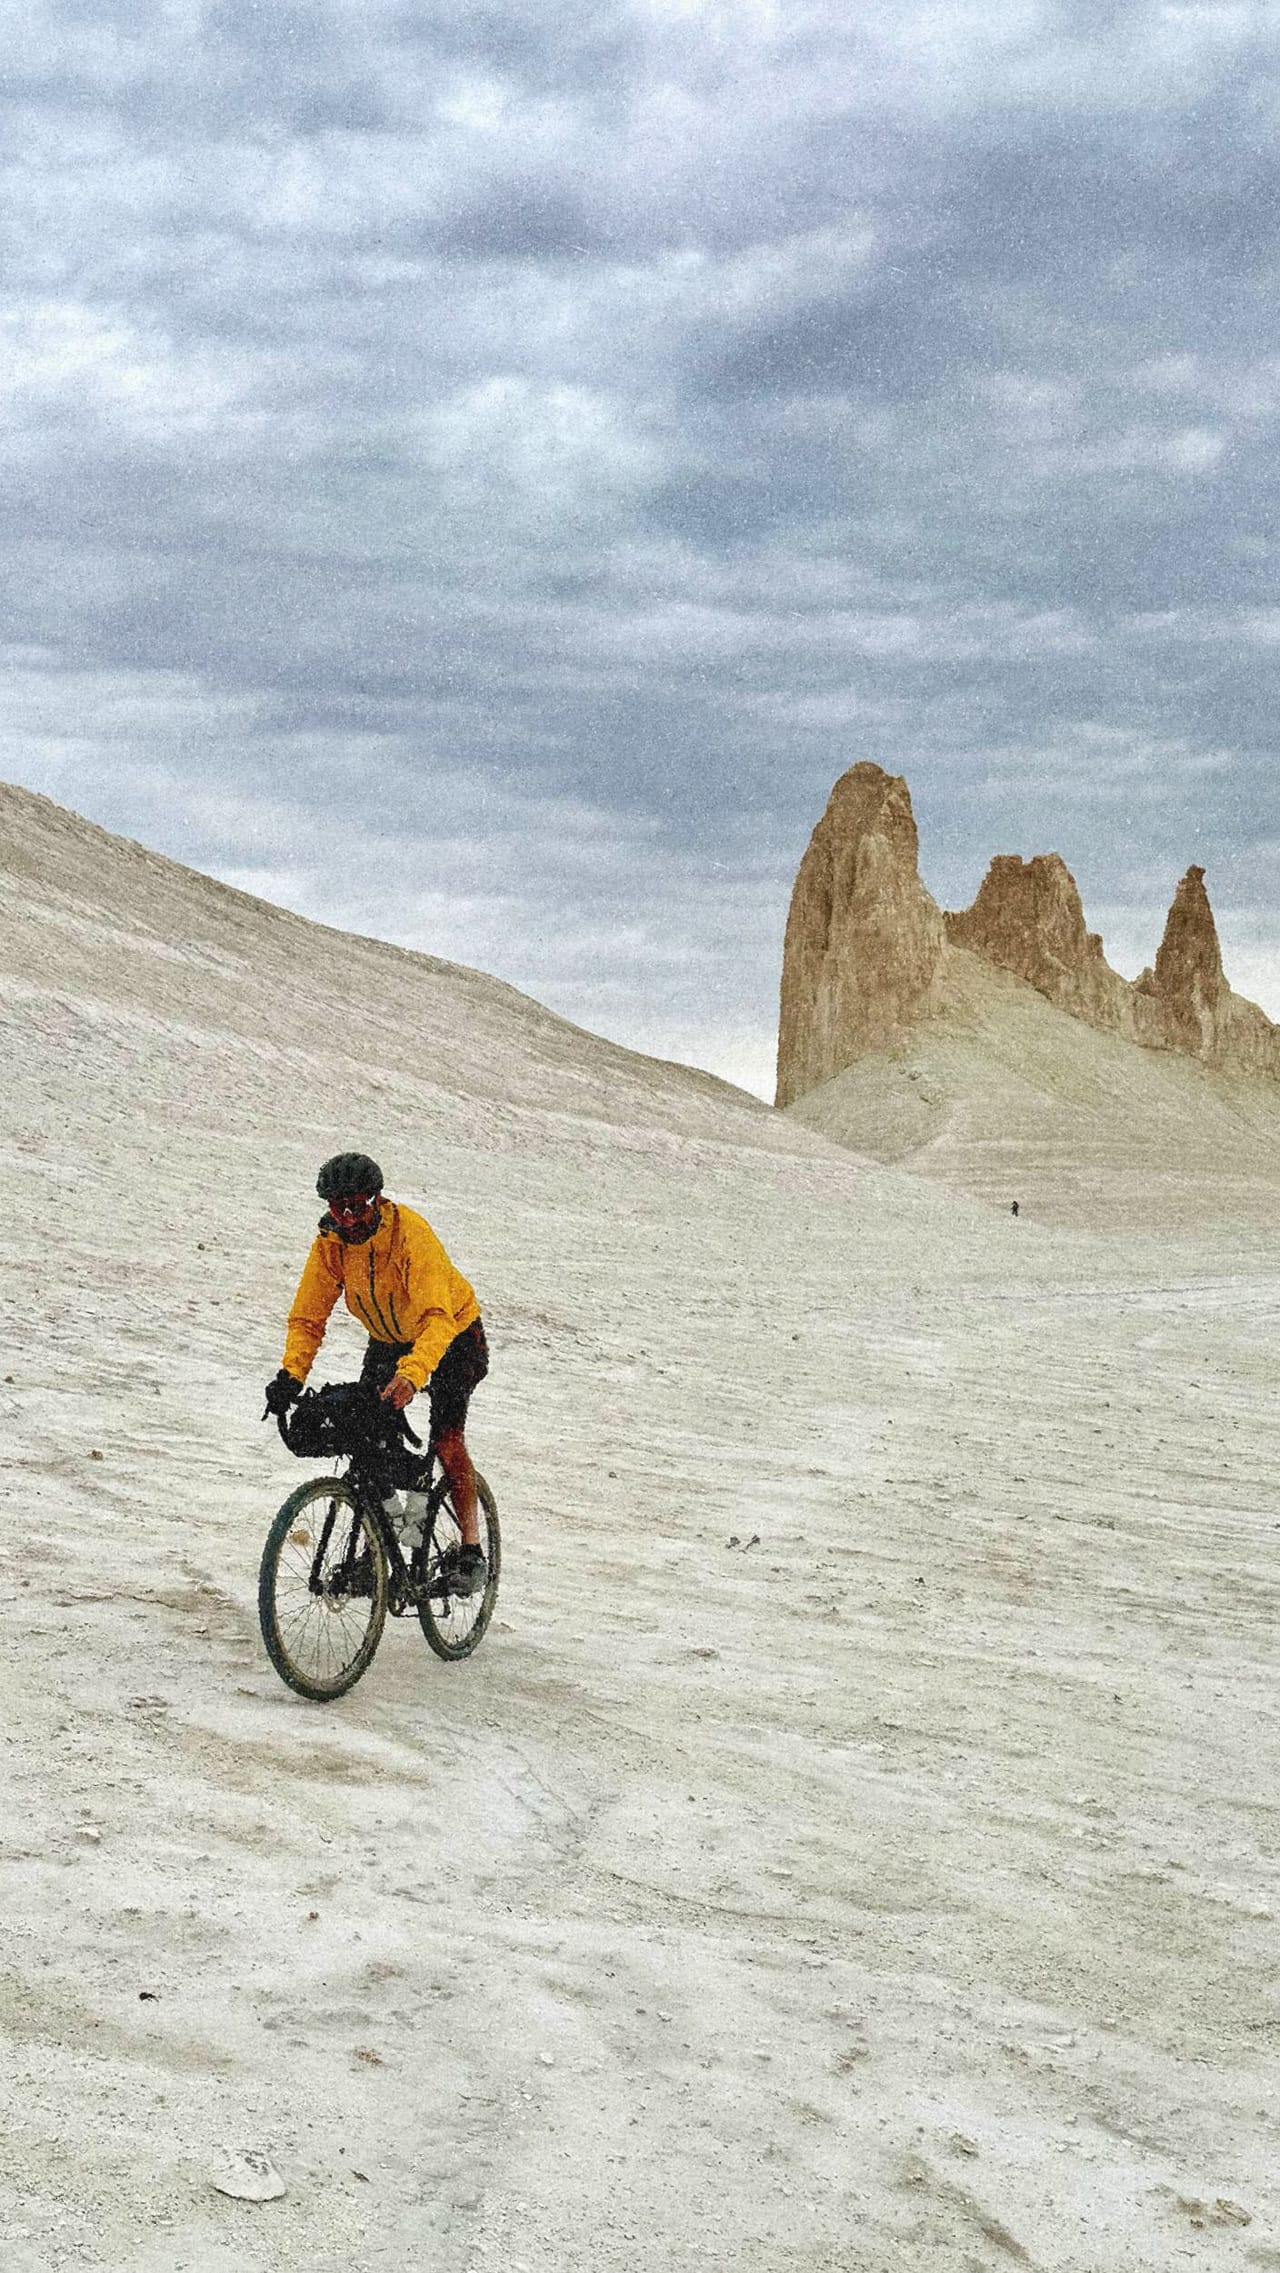
Terres d'Aventur... Instagram

Apr 27, 2025
60K followers
Engagement Rate
1.903%
Terres d'Aventur... Instagram
Apr 26, 2025
60K followers
Engagement Rate
1.445%
Terres d'Aventur... Instagram

May 17, 2025
60K followers
Engagement Rate
1.367%
チャネル全体のブランドエンゲージメント
複数チャネルのエンゲージメント分析
チャネル全体のブランドエンゲージメント
| チャンネル | エンゲージメント | 平均エンゲージメント |
|---|---|---|
| YouTube | 32 | 0.7 |
| Facebook | 2149 | 20.86 |
| Instagram | 24K | 139.01 |
| Average | 8697 | 53.52 |
ブランド動画の各チャネル別視聴回数
複数チャネルのエンゲージメント分析
ブランド動画の各チャネル別視聴回数
| チャンネル | 動画視聴回数 | 平均動画視聴回数 |
|---|---|---|
| YouTube | 1820 | 39.57 |
| Facebook | 38K | 1670 |
| Instagram | 121K | 1728 |
| Average | 54K | 1146 |


リアルタイムのインサイトでソーシャルメディア戦略を強化しませんか。
戦略的なインサイトを取得できます。すべてのチャンネルでソーシャルパフォーマンスを分析しましょう。異なる期間のメトリクスを比較し、数秒でレポートをダウンロードできます。