2月には、仕事のスピードが上がったことに気付くまで見逃しがちな改善がありました。
今月は、レポート作成のストレスを減らすことに注力しました。メトリクスのコンテキストがより明確になり、信頼できる並び替えも可能です。各プラットフォームで名称が変わる際のダッシュボード内の「翻訳」混乱も減少しました。
1. コンテキスト対応のハウツーガイド(必要な場所に表示されます)
ダッシュボードからコンテキスト対応のハウツーガイドに直接アクセスできるようになりました。
- Instagram視聴回数(変更点、解釈方法、レポート方法)
- Facebook視聴回数(旧インプレッションとの違いについて)
- クエリビルダー(コンテンツピラーのルールに関する実践ガイド)
Instagramの視聴回数セクション👇の例をご紹介します。
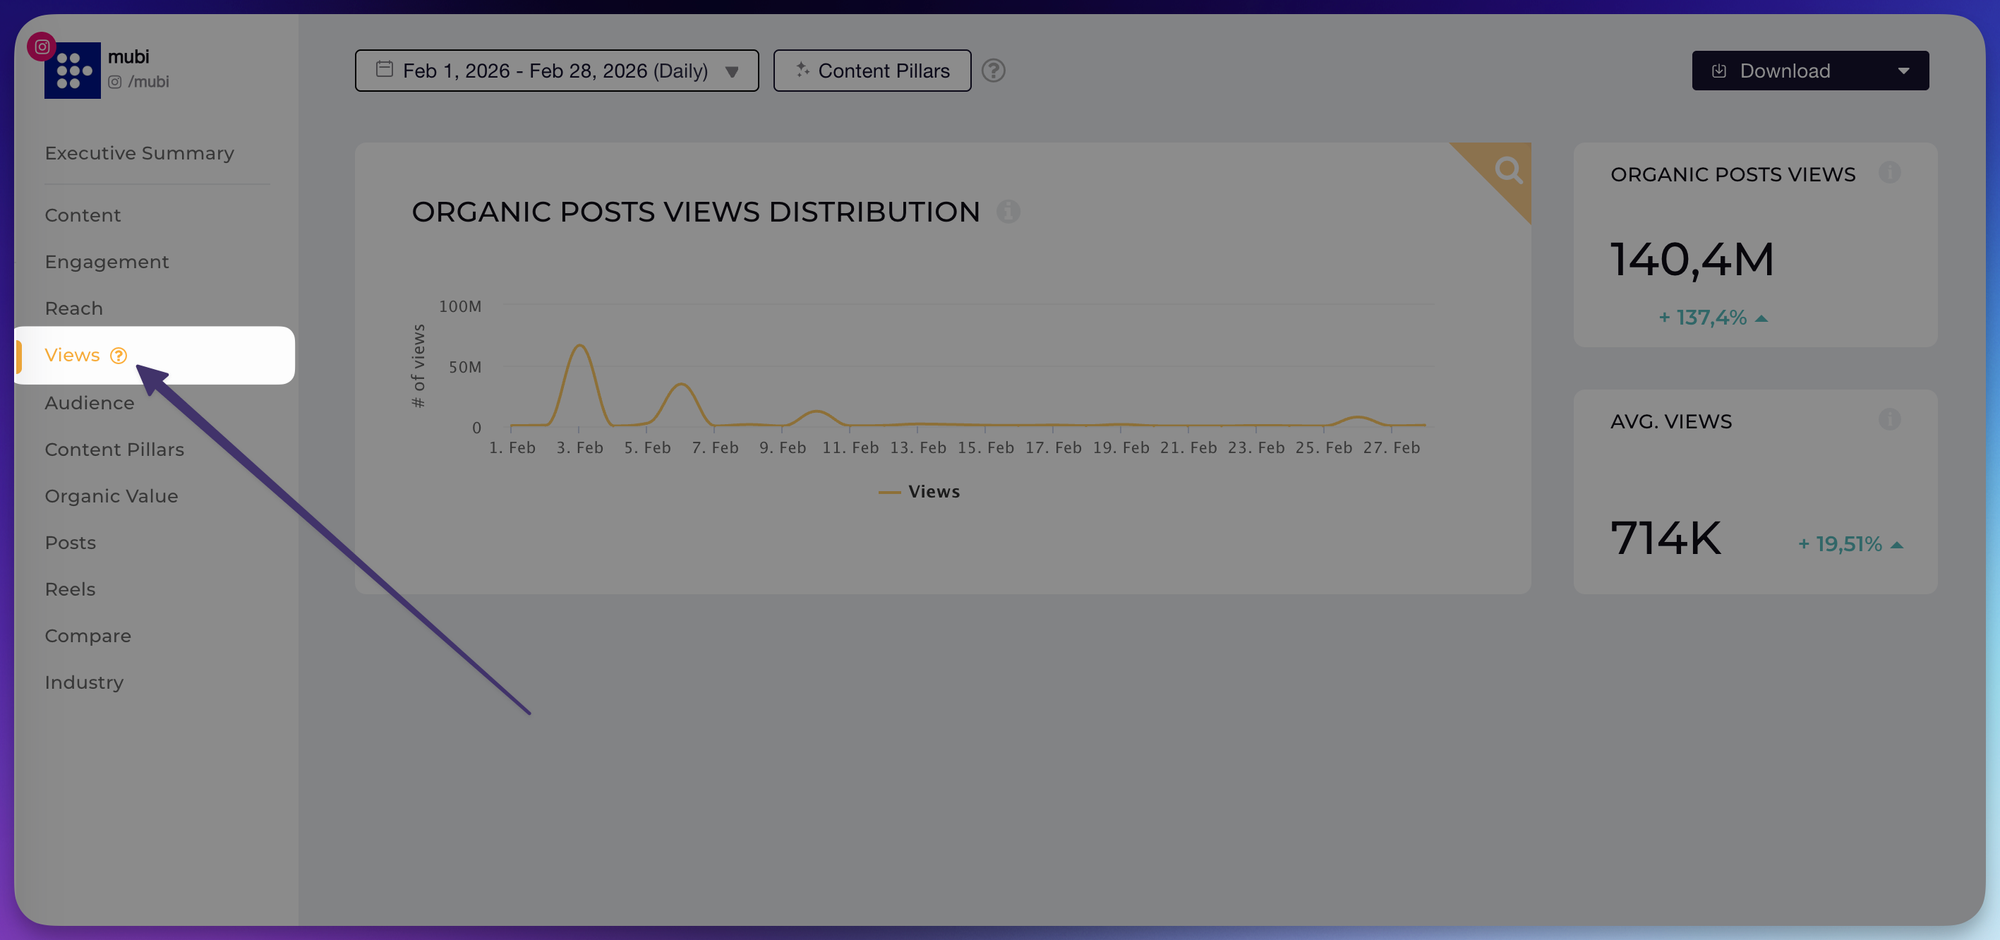
アイコンをクリックするとガイドが開きます👇
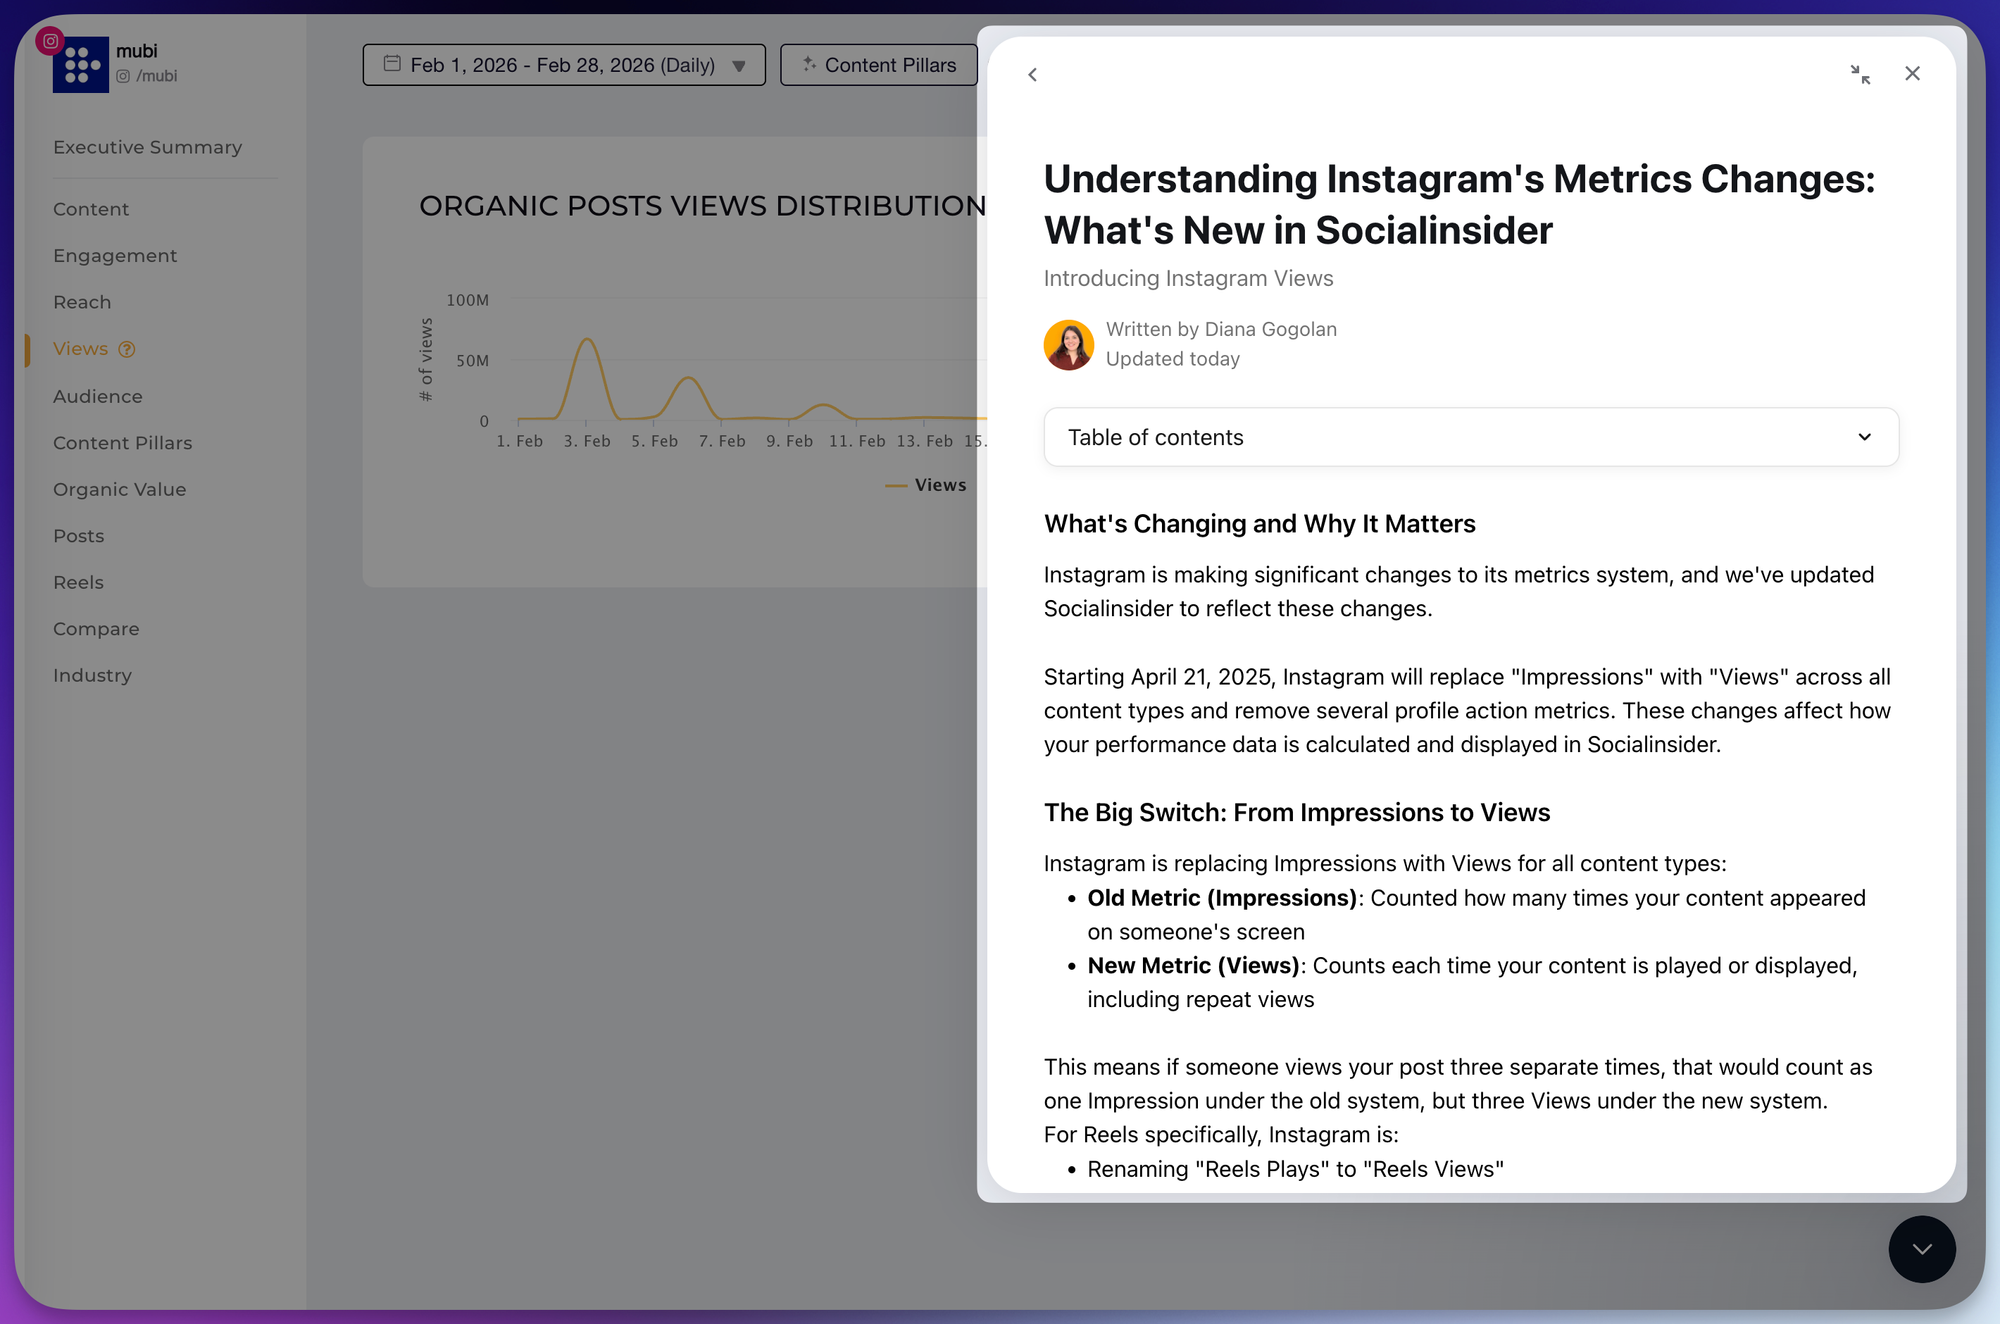
Instead of pausing your work to search docs (or second-guess a metric rename), the guidance now lives next to the charts and tables you’re already using.
It’s designed for the moment you’re building a report and need a confident explanation, fast.
2. Sorting Options (Views + Estimated Views)
You can now sort Instagram posts by 視聴回数 and 推定視聴回数 and get accurate results.
→ 改善点:
- テーブルビュー、エクスポート、投稿単位の数値でソートが統一されました
- 動画が多い時期でも成果の高いコンテンツを簡単に見つけられます
「トップ投稿」リストを見て「なんだか違和感がある…」と感じたことがある方へ。
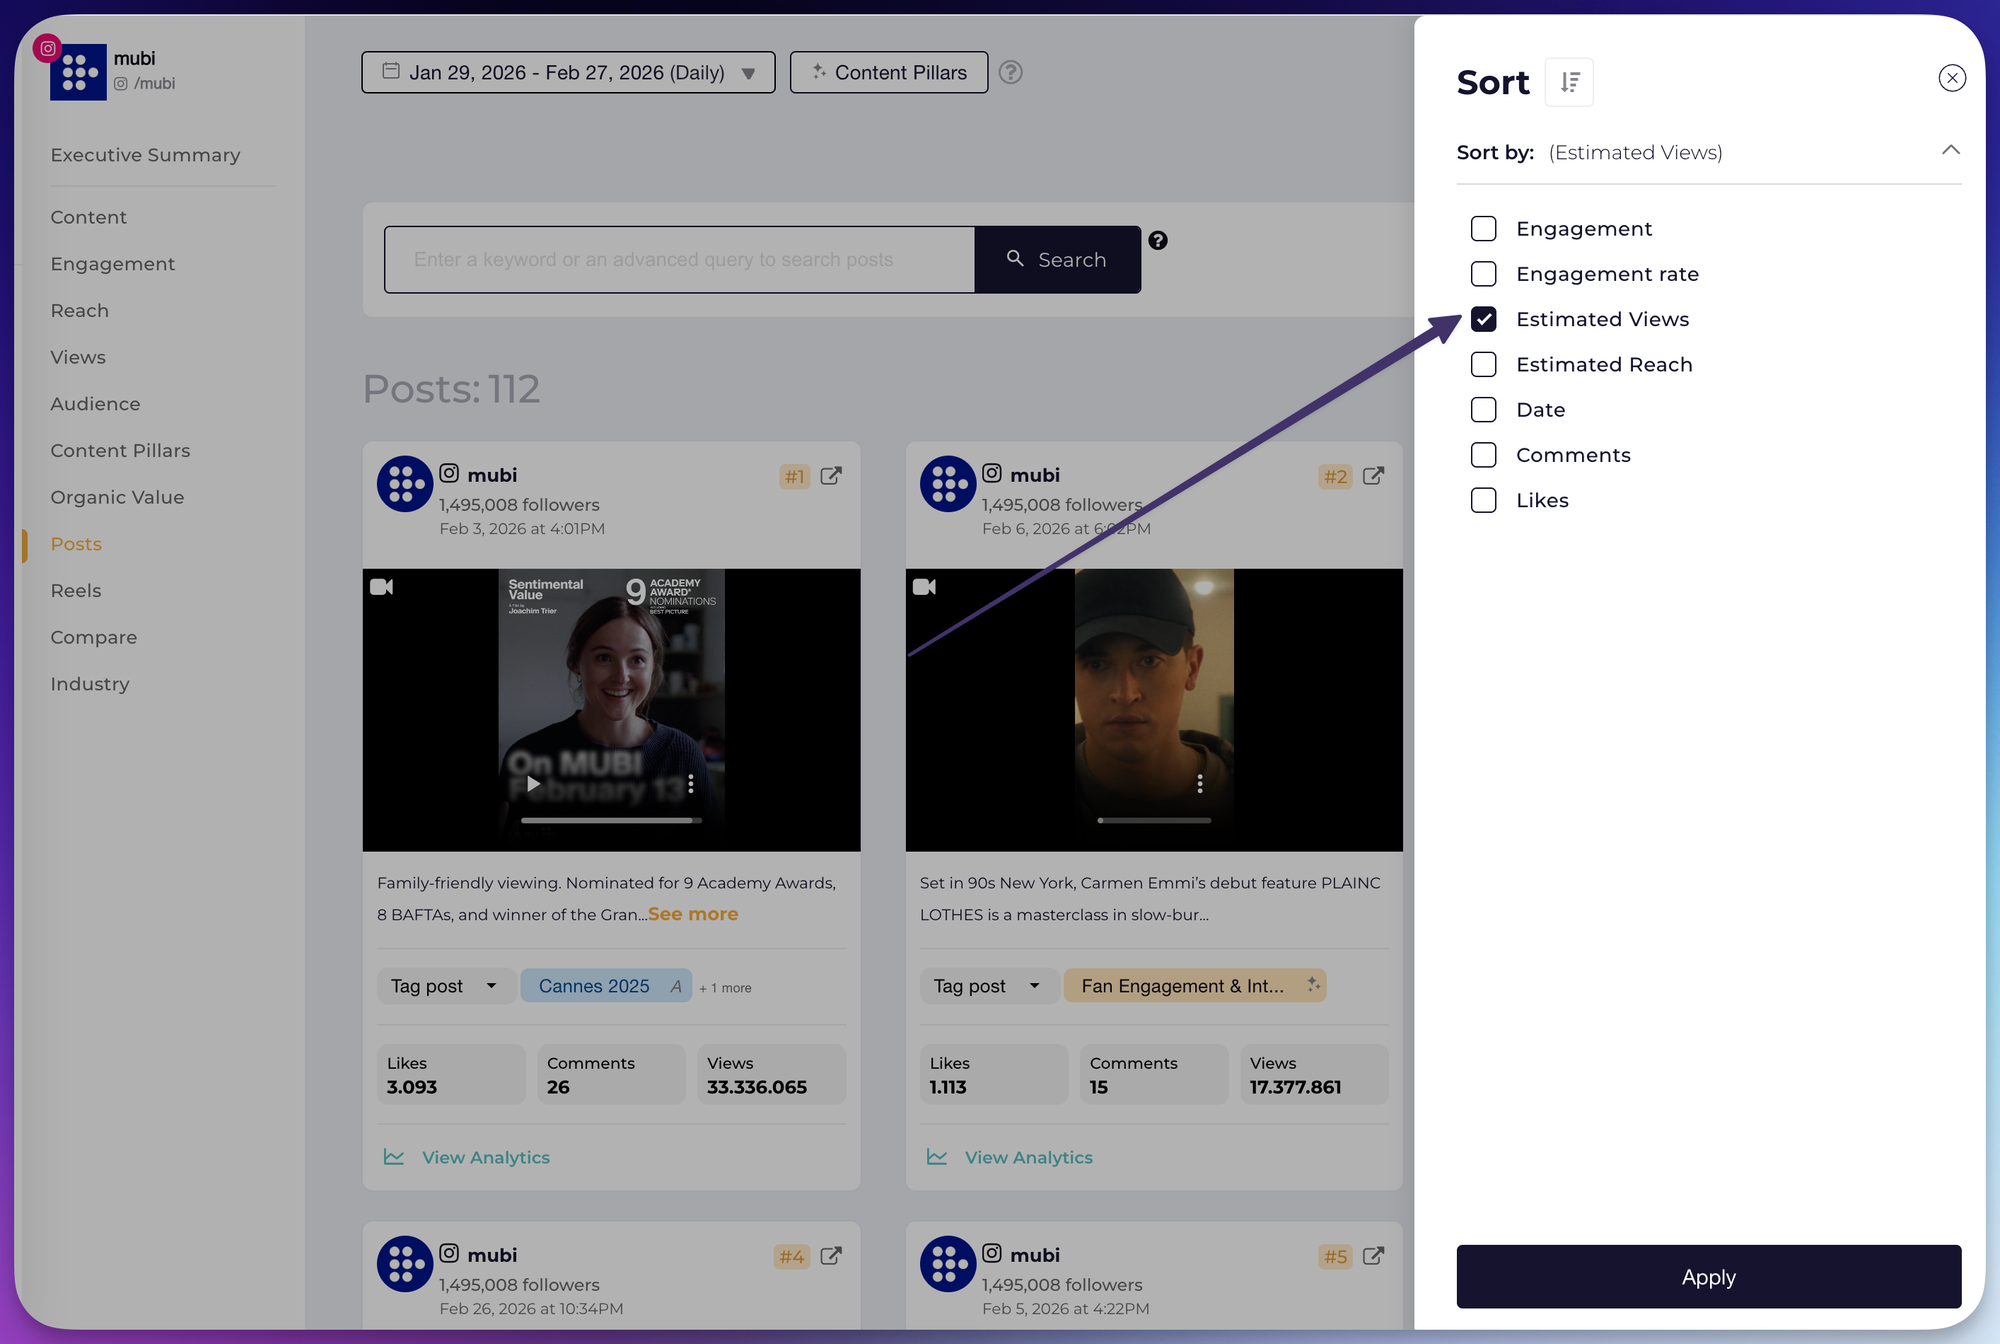
つまり、テーブル・エクスポート・投稿単位の数値でソート動作が一貫しています。安心してシェアできます。
- おすすめ: 動画が多い時期・リールのレポート
- 効果: 分析がより迅速に。手動チェックの手間が大幅に減ります。
3. Looker Studio Improvements
We made a few small improvements to our Looker Studio setup to make reporting smoother and more consistent, including alignment with the updated 視聴回数 language (including Facebook).
Small change, big difference when you’re building dashboards you need to explain quickly.
- Outcome:fewer naming mismatches
- メリット:ステークホルダーとの会話がスムーズになります。

Diana Gogolan
Socialinsider のプロダクトマネージャー。アイデアから成功した機能まで、設計・構築・テスト・リリースを担当しています。多様な形でストーリーを伝えることに情熱を持っています。

マネージャーに聞かれる前に、競合他社の動きを把握しましょう。
手作業なく、すぐにソーシャルメディアのベンチマークとレポートを取得できます。